. 2016 Oct 1;30(19):2173-2186.
doi: 10.1101/gad.284562.116. Epub 2016 Oct 13.

Condensin II mutation causes T-cell lymphoma through tissue-specific genome instability

Affiliations

Condensin II mutation causes T-cell lymphoma through tissue-specific genome instability

Jessica Woodward et al. Genes Dev. .

Abstract

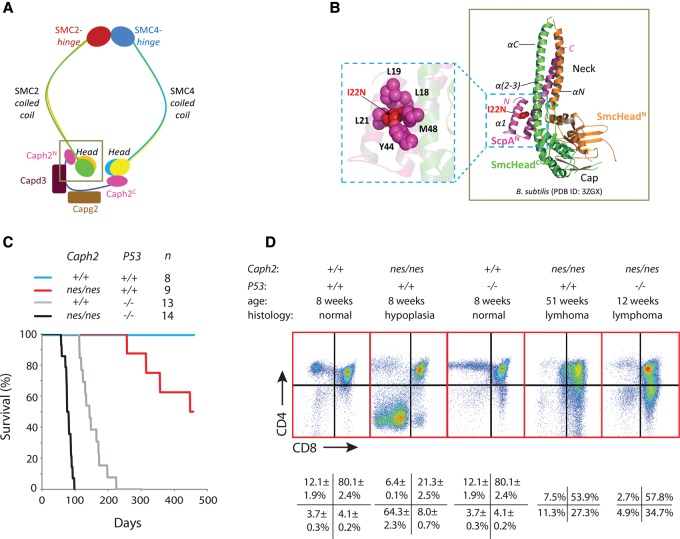
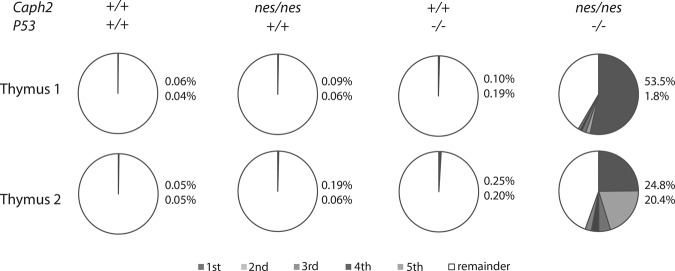
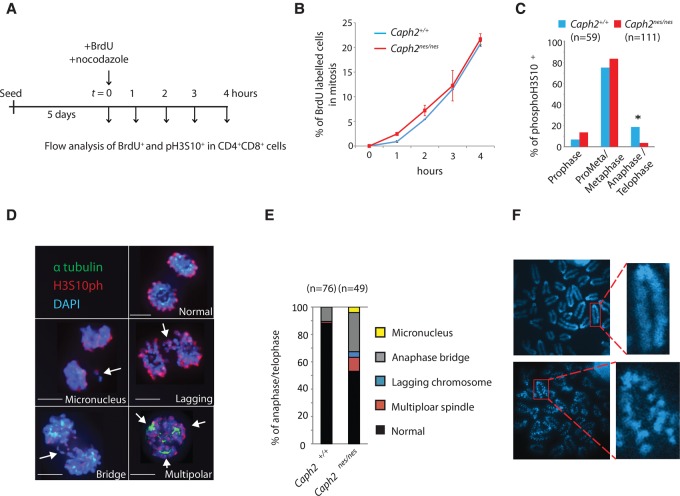
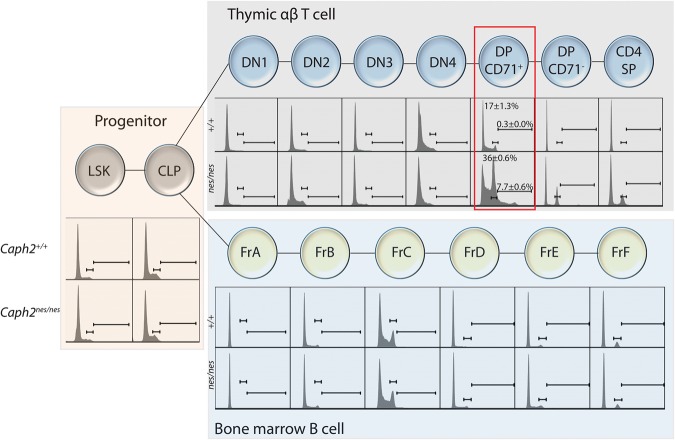
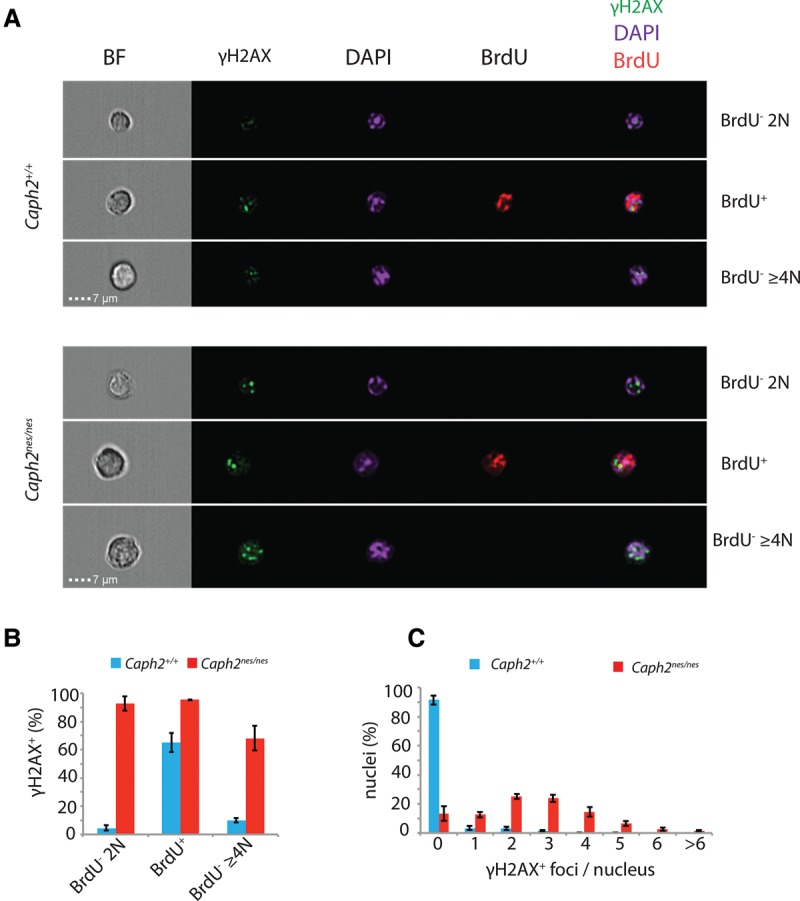
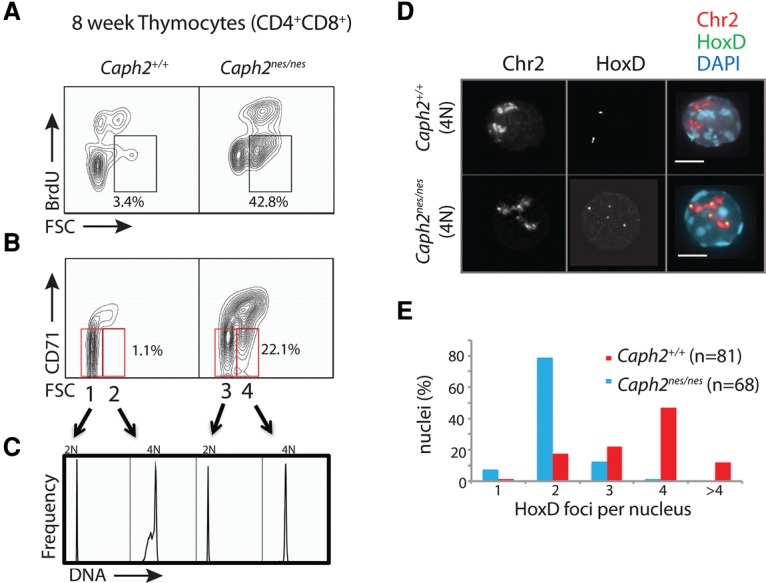
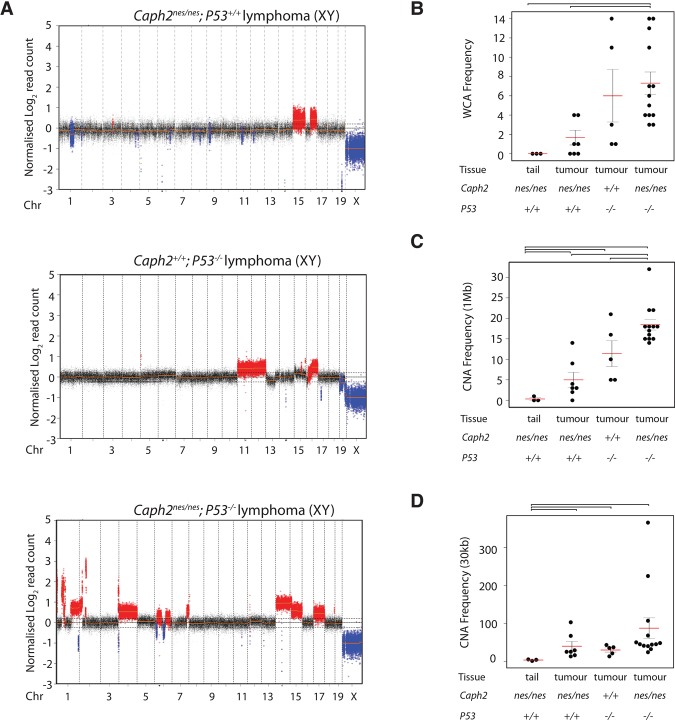
Chromosomal instability is a hallmark of cancer, but mitotic regulators are rarely mutated in tumors. Mutations in the condensin complexes, which restructure chromosomes to facilitate segregation during mitosis, are significantly enriched in cancer genomes, but experimental evidence implicating condensin dysfunction in tumorigenesis is lacking. We report that mice inheriting missense mutations in a condensin II subunit (Caph2nes) develop T-cell lymphoma. Before tumors develop, we found that the same Caph2 mutation impairs ploidy maintenance to a different extent in different hematopoietic cell types, with ploidy most severely perturbed at the CD4+CD8+ T-cell stage from which tumors initiate. Premalignant CD4+CD8+ T cells show persistent catenations during chromosome segregation, triggering DNA damage in diploid daughter cells and elevated ploidy. Genome sequencing revealed that Caph2 single-mutant tumors are near diploid but carry deletions spanning tumor suppressor genes, whereas P53 inactivation allowed Caph2 mutant cells with whole-chromosome gains and structural rearrangements to form highly aggressive disease. Together, our data challenge the view that mitotic chromosome formation is an invariant process during development and provide evidence that defective mitotic chromosome structure can promote tumorigenesis.

Keywords: chromosome structure; condensin; genome instability; lymphoma; mitosis.


Figures

Figure 1.
Figure 1.
Missense mutations in Caph2 induce thymic lymphoma. (A) Schematic of the condensin II complex (Bürmann et al. 2013; Piazza et al. 2014). The box indicates the region that is expanded in B. (B, right) Three-dimensional structure of the Smc head domain (SmcHead) and ScpA N-terminal domain (ScpAN) from Bacillus subtilis (Protein Data Bank ID 3ZGX) (Bürmann et al. 2013) is shown using PyMOL. The two noncontiguous sequence regions that together form the Smc ATPase head domain are color-coded in orange (SmcHeadN) and green (SmcHeadC), respectively, while the ScpAN domain fragment is shown in pink. (Left) The side chain of the I15 equivalent residue in B. subtilis ScpA (I22) and its interacting residues is depicted in sphere representation. Note that residues Y44 and M48 form part of the second α helix, which makes direct contact with the SMC coiled coil. (C) Kaplan-Meier plot showing survival of Caph2nes/nes and P53−/− mutant animals. The study was terminated at 15 mo, and surviving animals were examined for tumors during necropsy. (D) Flow cytometry dot plots show the distribution of thymic T-cell subsets according to CD4 and CD8 expression in tissue from young adult mice (±SEM; n = 5) and in representative terminal thymic lymphomas.
Figure 2.
Figure 2.
Caph2 mutation accelerates T-cell clonal outgrowth in a P53-dependent manner. Pie charts show the frequency of the five most abundant TCRβ clones (gray segments) in the thymuses of animals of different genotypes at 3-wk post-partum relative to the remainder of clones detected in each sample (white segment). The percentage of the top two clones in each sample is listed at the right of each chart. Data for P53 single-mutant animals were published previously (Dudgeon et al. 2014) and reanalyzed through the ImmunoSeq Analyzer portal on the Adaptive Biotechnologies Web site.
Figure 3.
Figure 3.
Tumor-causing Caph2 mutations impair mitotic progression. (A) Overview of the BrdU chase experiment to assess the progression of primary CD4+CD8+ thymocytes from S phase into M phase. (B) Line graph showing the accumulation of BrdU+ cells in M phase (pH3S10+) over a 4-h time course, as described in A. Error bars show SEM of two biological replicates and are representative of two independent experiments. (C) Mitotic phase distribution of unsynchronized H3S10P+ thymocytes from wild-type (blue) and Caph2nes/nes (red) OP9-DL1 cocultures stained with anti-H3S10P, anti-α-tubulin, and DAPI. Cells staining positive for the mitotic marker H3S10P were visually assigned to one of three mitotic phase categories. Data were pooled from two biological replicate experiments. n = 59 mitotic cells for Caph2+/+; n = 111 for Caph2nes/nes. (*) P < 0.003, two-tailed Fisher's exact. (D) Examples of anaphase/telophase cells following MG132 washout in Caph2nes/nes OP9/DL1 cocultures, costained for α-tubulin (green), H3S10P (red), and DAPI (blue). For clarity, tubulin staining is shown in only the multipolar spindle image. Bars, 3 µm. (E) The percentage of normal and abnormal anaphase/telophase T cells from OP9/DL1 cocultures 1 h following MG132 washout for wild type and the Caph2 mutant. Data represent one experiment. (F) Structured illumination microscopy (SIM) images of DAPI-stained metaphase chromosomes from wild-type (top) and Caph2nes/nes (bottom) cells. Images are representative of >30 metaphase spreads from three independent experiments.
Figure 4.
Figure 4.
Mitotic perturbation arises specifically in the tumor-initiating cell population. Flow cytometry histograms show cellular DNA content profiles during differentiation of T and B lymphocytes from multipotent progenitors in vivo. Tissues were harvested at 6–8 wk, before tumors are first detected. The tumor-initiating cell population (DP CD71+) is highlighted with a red box. Gates represent the 4N and >4N populations, which are quantified here for the tumor-initiating cell population and for all B-cell and T-cell subsets in Supplemental Figure S5. B-cell subsets were classified into Hardy fractions A–F (Hardy et al. 1991). Gating schemes used to identify each population are shown in Supplemental Figure S6, and cell surface markers and antibodies are listed in Supplemental Tables S5 and S6, respectively. Each histogram represents at least 2000 cells and is representative of three biological replicates for progenitor subsets and five biological replicates for T-cell and B-cell subsets.
Figure 5.
Figure 5.
Widespread DNA damage in Caph2 mutant thymocytes. (A) Multispectral images showing representative thymocytes from different cell cycle stages, classified based on DNA content and BrdU incorporation. Images were acquired on an ImageStream flow cytometer using a 60× objective. (B) Histogram showing the percentage of cells with at least one bright γH2AX focus at different cell cycle stages. (C) Histogram showing the frequency of γH2AX foci per nucleus across all cell cycle stages. For B and C, error bars show SEM of n = 3 biological replicate experiments, each comprising 10,000 cells per sample.
Figure 6.
Figure 6.
Genome doubling causes cell cycle exit in Caph2 mutant thymocytes. (A) Flow cytometry contour plots (gated on CD4+CD8+ thymocytes from 6-wk to 12-wk animals) showing a substantial increase in the proportion of abnormally large (FSChi) nonproliferating (BrdU) cells in Caph2nes/nes animals. Percentages represent mean values from three biological replicates. (B) Contour plots are presented as in A, with proliferation status measured by cell surface expression of CD71. Gates that define populations 1–4 in C are shown in red. Percentages represent mean values from three biological replicates. (C) DNA content of populations 1–4 from B, determined by flow cytometry quantification of DAPI fluorescence. The noncycling population that is greatly expanded in the Caph2nes/nes mutant thymus (FSChiCD71lo) is exclusively 4N. Data are representative of five biological replicates. (D) FISH analysis of FACS-purified nonproliferating large thymocytes (populations 2 and 4 in B) using a chromosome 2 (Chr2) exome paint (red) and a probe (green) corresponding to the HoxD locus (HoxD) on chromosome 2. Two paired fosmid signals per nucleus are visible in population 2, whereas population 4 has four individual signals per nucleus, indicating the absence of sister chromatid cohesion. Bar, 4 μm. (E) Quantification of spatially separated (>0.5 µm) HoxD signals is depicted in the histogram. Data were pooled from two biological replicates. n = 81 Caph2+/+; n = 68 Caph2nes/nes.
Figure 7.
Figure 7.
P53 status determines the frequency of WCA and segmental aneuploidy in Caph2 mutant tumors. (A) Example copy number aberration (CNA) plots showing read depth from shallow whole-genome sequencing of Caph2nes/nes; P53+/+, Caph2+/+; P53−/−, and Caph2nes/nes; P53−/− double-mutant tumors. Copy number gains are shown in red, and deletions are shown in blue. Additional plots are shown in Supplemental Figure S9. (B) Frequency of WCAs based on shallow whole-genome sequencing in tumors arising on the indicated genotypes and control DNA from aged (9–15 mo) Caph2nes/nes tail. Red bars indicate the mean. Error bars show SEM. Brackets above the plot link conditions for which two-tailed t-tests gave significant P-values (<0.001). (C) Frequency of CNAs ≥1 Mb, presented as in B. Error bars link conditions for which two-tailed t-tests gave significant P-values (<0.03). (D) Frequency of CNAs ≥30 kb, presented as in B. Error bars link conditions for which two-tailed t-tests gave significant P-values (<0.05).

References

    1. Ahmad S, Gromiha M, Fawareh H, Sarai A. 2004. ASAView: database and tool for solvent accessibility representation in proteins. BMC Bioinformatics 5: 51. - PMC - PubMed
    1. Boyle S, Rodesch MJ, Halvensleben HA, Jeddeloh JA, Bickmore WA. 2011. Fluorescence in situ hybridization with high-complexity repeat-free oligonucleotide probes generated by massively parallel synthesis. Chromosome Res 19: 901–909. - PMC - PubMed
    1. Brekelmans P, van Soest P, Voerman J, Platenburg PP, Leenen PJM, van Ewijk W. 1994. Transferrin receptor expression as a marker of immature cycling thymocytes in the mouse. Cell Immunol 159: 331–339. - PubMed
    1. Bürmann F, Shin H-C, Basquin J, Soh Y-M, Giménez-Oya V, Kim Y-G, Oh B-H, Gruber S. 2013. An asymmetric SMC–kleisin bridge in prokaryotic condensin. Nat Struct Mol Biol 20: 371–379. - PubMed
    1. Carlson CS, Emerson RO, Sherwood AM, Desmarais C, Chung M-W, Parsons JM, Steen MS, LaMadrid-Herrmannsfeldt MA, Williamson DW, Livingston RJ, et al. 2013. Using synthetic templates to design an unbiased multiplex PCR assay. Nat Commun 4: 2680. - PubMed

MeSH terms