. 2016 Dec 16;291(51):26241-26251.
doi: 10.1074/jbc.M116.754218. Epub 2016 Oct 13.

Coordinated Activities of Multiple Myc-dependent and Myc-independent Biosynthetic Pathways in Hepatoblastoma

Affiliations

Coordinated Activities of Multiple Myc-dependent and Myc-independent Biosynthetic Pathways in Hepatoblastoma

Huabo Wang et al. J Biol Chem. .

Abstract

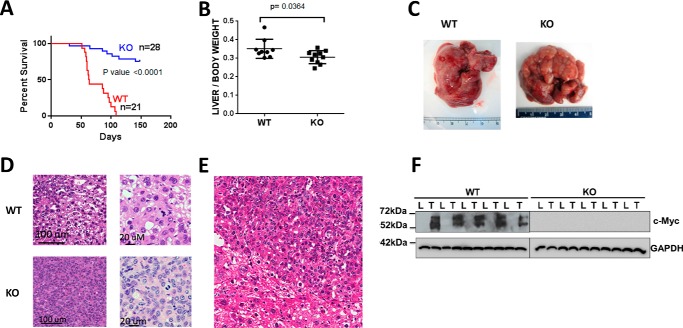
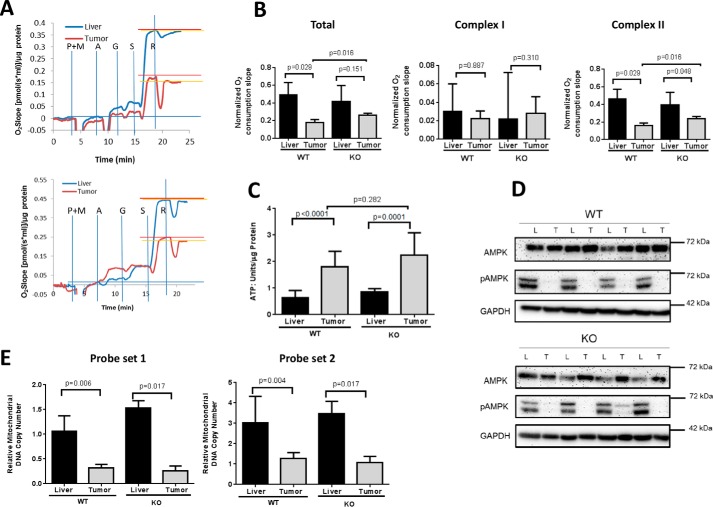
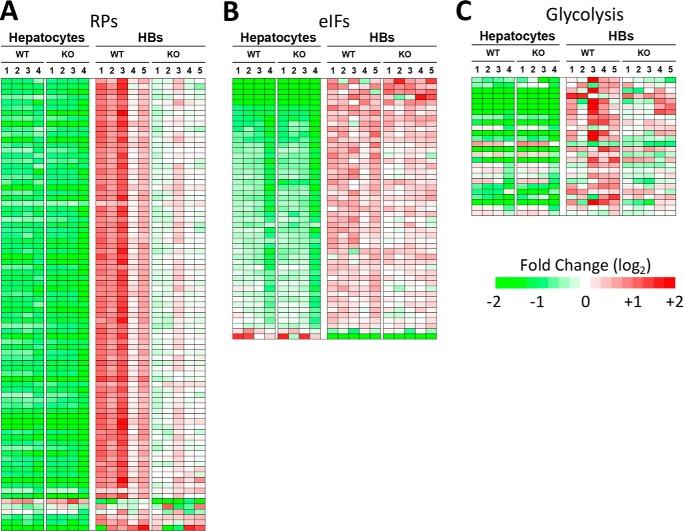
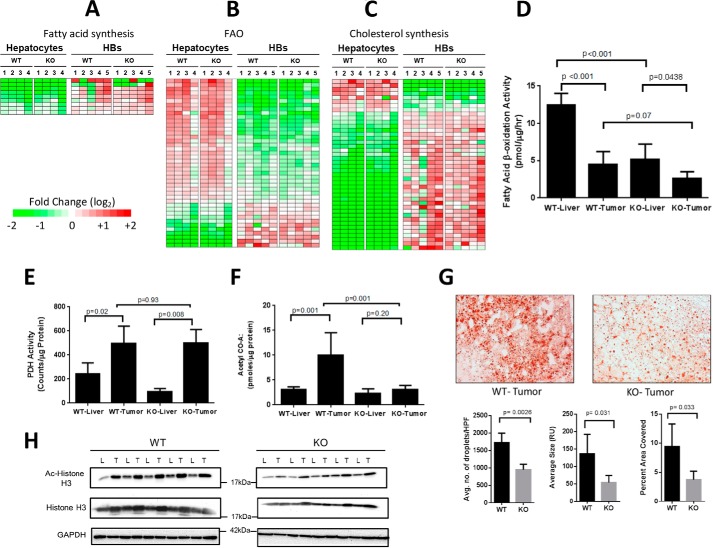
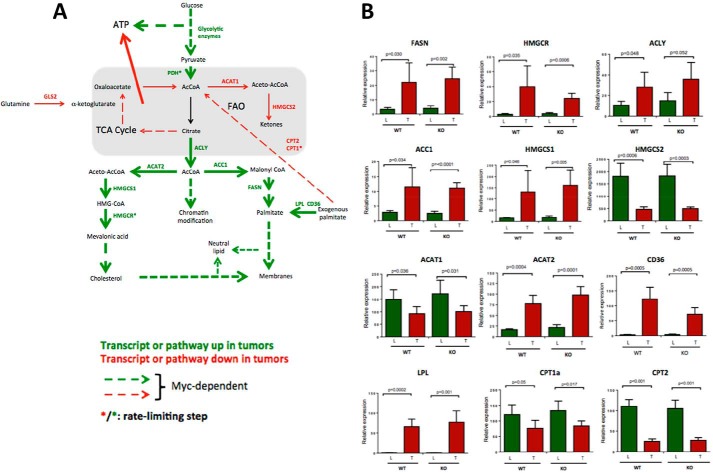
Hepatoblastoma (HB) is associated with aberrant activation of the β-catenin and Hippo/YAP signaling pathways. Overexpression of mutant β-catenin and YAP in mice induces HBs that express high levels of c-Myc (Myc). In light of recent observations that Myc is unnecessary for long-term hepatocyte proliferation, we have now examined its role in HB pathogenesis using the above model. Although Myc was found to be dispensable for in vivo HB initiation, it was necessary to sustain rapid tumor growth. Gene expression profiling identified key molecular differences between myc+/+ (WT) and myc-/- (KO) hepatocytes and HBs that explain these behaviors. In HBs, these included both Myc-dependent and Myc-independent increases in families of transcripts encoding ribosomal proteins, non-structural factors affecting ribosome assembly and function, and enzymes catalyzing glycolysis and lipid bio-synthesis. In contrast, transcripts encoding enzymes involved in fatty acid β-oxidation were mostly down-regulated. Myc-independent metabolic changes associated with HBs included dramatic reductions in mitochondrial mass and oxidative function, increases in ATP content and pyruvate dehydrogenase activity, and marked inhibition of fatty acid β-oxidation (FAO). Myc-dependent metabolic changes included higher levels of neutral lipid and acetyl-CoA in WT tumors. The latter correlated with higher histone H3 acetylation. Collectively, our results indicate that the role of Myc in HB pathogenesis is to impose mutually dependent changes in gene expression and metabolic reprogramming that are unattainable in non-transformed cells and that cooperate to maximize tumor growth.

Keywords: Myc (c-Myc); beta-catenin (B-catenin); hepatocellular carcinoma; metabolism; oxidative phosphorylation; yes-associated protein (YAP).


Figures

FIGURE 1.
FIGURE 1.
Properties of WT and KO tumors. A, survival curves of WT or KO mice inoculated with mutant β-catenin + YAP SB vectors by HDTVI. The study was terminated at week 22. B, liver weights from the survival curves shown in A. The results include all surviving KO mice. C, gross appearance of typical tumors arising in WT and KO livers. Note that although the depicted WT and KO tumor are of comparable size and appearance, they were obtained at different times due to the slower growth of the latter. D, histologic appearance of WT and KO HBs. Sections were stained with H&E. WT tumors showed small indistinct nodules with variation in nuclear size and frequent mitoses resembling pleomorphic fetal or HCC-like morphology. KO tumors were more distinct with a predominance of small uniform cells with abundant, eosinophilic cytoplasm and uniform small nuclei with inconspicuous to absent nucleoli and many mitoses. E, lower power view of H&E-stained section of normal liver-tumor border emphasizing the size differences between tumor cells (center and upper right) and normal hepatocytes (lower left). The crowded fetal morphology is more apparent. There was also significant nuclear unrest and variation in size in the liver surrounding the nodules. F, immunoblots for Myc protein in livers (L) and HBs (T) from WT and KO mice. GAPDH was included as a loading control. Error bars indicate ± S.E.
FIGURE 2.
FIGURE 2.
Mitochondrial function in WT and KO livers and HBs. A, typical Oroboros Oxygraph 2k respirometer tracings in paired sets of WT (top) and KO (bottom) livers and tumors. Vertical blue lines indicate the points of addition of the Complex I substrates pyruvate (P), malate (M), and glutamine (G) and the Complex II substrate succinate (S). A = ADP; R = the Complex I inhibitor rotenone, the concentration of which had been previously titrated to provide maximal Complex I inhibition. The results depicted here were adjusted for differences in total protein levels. B, quantification of the results depicted in A. Each point represents total rates of oxygen consumption or the individual activities of Complex I or Complex II in response to their respective substrates. Total activity was calculated based on the spike in oxygen consumption following the addition of succinate. Complex II activity was derived by calculating the residual O2 consumption remaining after rotenone addition (horizontal orange lines in A). C, ATP levels. n = 4–5 samples/group. D, AMPK and phosphorylated AMPK (pAMPK) levels in tumors (T) and livers (L). Liver and tumor lysates, like those shown in in Fig. 1F, were assessed for total AMPK or its active (phospho-Thr172) form. GAPDH served as a control for protein loading. E, mitochondrial mass in livers and HBs. Two different probe sets (probe set 1 and probe set 2) were used to amplify mtDNA from two unique genomic regions using a TaqMan-based approach. mtDNA content was normalized to a nuclear DNA target that was amplified by a similar approach. n = 4–6 samples/group. Error bars indicate ± S.E.
FIGURE 3.
FIGURE 3.
Transcriptional pathways that distinguish WT and KO HBs include those involved in ribosomal biogenesis, translational control and glycolysis. A, transcripts encoding RPs. Relative to WT hepatocytes, WT tumors up-regulated RP transcripts by an average of 5.2-fold versus 3.6-fold for KO HB (p < 0.0001). Red = up-regulated; green = down-regulated. B, transcripts identified by IPA as belonging to pathways involved in signaling by eIF2, eIF4, p70S6KJ, and mTOR. Each of these pathways also contained numerous RP transcripts, which are now included in A. As a group, these transcripts were similarly up-regulated in WT and KO HBs. C, transcripts encoding glycolytic enzyme. Relative to their corresponding livers, WT HB transcripts were up-regulated by an average of 11.2-fold, whereas KO HB transcripts were up-regulated by an average of 8.9-fold (p = 0.0004). Panels A–C also contain additional transcripts that did not meet the false discovery rate threshold but were nevertheless differentially expressed at a level of p < 0.05 (see supplemental Figs. S5–S7 for the identities of each set of transcripts).
FIGURE 4.
FIGURE 4.
Deregulation of pathways involving lipid and acetyl-CoA metabolism in WT and KO HBs. A–C, differential expression of transcripts related to fatty acid synthesis, FAO, and cholesterol synthesis in WT and KO hepatocytes and HBs. Non-overlapping sets of transcripts from the relevant IPAs depicted in supplemental Fig. S8 are shown as are additional members of these pathways (q > 0.05> p: see supplemental Figs. S9–S11 for absolute expression differences among the transcripts depicted here). D, β-oxidation of [3H]palmitate in WT and KO livers and tumors. E, PDH assays were performed in triplicate on four samples from each of the indicated groups. F, acetyl Co-A levels in WT and KO livers and tumors. The results represent the mean of at least five samples/group each performed in triplicate. G, Oil Red O staining showing typical examples of neutral lipid staining in WT and KO HBs. Histograms beneath the micrographs show quantification for lipid droplet number, size, and intracellular area composed of lipid in a series of sections compiled from five representative tumors from each group. H, immunoblots of representative WT and KO livers (L) and tumors (T) probed with anti-acetyl histone H3 (Lys-9/Lys-14) or anti-histone H3 antibodies. Calculations of the Ac-H3:Total H3 ratios in each sample showed them to be higher in WT tumors than in KO tumors after adjusting to total histone H3 (p = 0.038). Error bars indicate ± S.E.
FIGURE 5.
FIGURE 5.
Myc-dependent and Myc-independent pathways in HB tumorigenesis. A, summary of relevant tumor pathways and targets. ATP generated by the up-regulation of glycolysis in tumors is sufficient to offset the overall loss of ATP generated by reduced Oxphos. B, relevant levels of expression in hepatocytes and HBs of the transcripts encoding the enzymes depicted in A. Data were taken from the results shown in Fig. 4 and supplemental Fig. S9. Error bars indicate ± S.E. The abbreviations used are: FASN, fatty acid synthase; HMGCR, HMG-coenzyme A reductase; ACLY, ATP citrate lyase; ACC1, acetyl-CoA carboxylase; HMGCS1 & 2, HMG-coenzyme S synthase, cytoplasmic and mitochondrial, respectively; ACAT1&2, acetyl-CoA acetyltransferase: mitochondrial and cytoplasmic, respectively; CD36, receptor for thrombospondin, oxidized low density lipoprotein, oxidized phospholipids, long-chain fatty acids, and native lipoproteins; LPL, lipoprotein lipase; CPT1a, carnitine palmitoyltransferase 1A; CPT2, carnitine palmitoyltransferase; PDH, pyruvate dehydrogenase.

References

    1. De Ioris M., Brugieres L., Zimmermann A., Keeling J., Brock P., Maibach R., Pritchard J., Shafford L., Zsiros J., Czaudzerna P., and Perilongo G. (2008) Hepatoblastoma with a low serum α-fetoprotein level at diagnosis: the SIOPEL group experience. Eur. J. Cancer 44, 545–550 - PubMed
    1. Heck J. E., Meyers T. J., Lombardi C., Park A. S., Cockburn M., Reynolds P., and Ritz B. (2013) Case-control study of birth characteristics and the risk of hepatoblastoma. Cancer Epidemiol. 37, 390–395 - PMC - PubMed
    1. Hamada Y., Takada K., Fukunaga S., and Hioki K. (2003) Hepatoblastoma associated with Beckwith-Wiedemann syndrome and hemihypertrophy. Pediatr. Surg. Int. 19, 112–114 - PubMed
    1. Spector L. G., and Birch J. (2012) The epidemiology of hepatoblastoma. Pediatr. Blood Cancer 59, 776–779 - PubMed
    1. Karim R., Tse G., Putti T., Scolyer R., and Lee S. (2004) The significance of the Wnt pathway in the pathology of human cancers. Pathology 36, 120–128 - PubMed

MeSH terms