. 2016 Sep 15;120(36):20437-20445.
doi: 10.1021/acs.jpcc.6b07089. Epub 2016 Aug 23.

Pronounced Environmental Effects on Injection Currents in EGaIn Tunneling Junctions Comprising Self-Assembled Monolayers

Affiliations

Pronounced Environmental Effects on Injection Currents in EGaIn Tunneling Junctions Comprising Self-Assembled Monolayers

Marco Carlotti et al. J Phys Chem C Nanomater Interfaces. .

Abstract

Large-area tunneling junctions using eutectic Ga-In (EGaIn) as a top contact have proven to be a robust, reproducible, and technologically relevant platform for molecular electronics. Thus far, the majority of studies have focused on saturated molecules with backbones consisting mainly of alkanes in which the frontier orbitals are either highly localized or energetically inaccessible. We show that self-assembled monolayers of wire-like oligophenyleneethynylenes (OPEs), which are fully conjugated, only exhibit length-dependent tunneling behavior in a low-O2 environment. We attribute this unexpected behavior to the sensitivity of injection current on environment. We conclude that, contrary to previous reports, the self-limiting layer of Ga2O3 strongly influences transport properties and that the effect is related to the wetting behavior of the electrode. This result sheds light on the nature of the electrode-molecule interface and suggests that adhesive forces play a significant role in tunneling charge-transport in large-area molecular junctions.


Conflict of interest statement

The authors declare no competing financial interest.

Figures

Figure 1
Figure 1
OPE compounds used to prepare self-assembled monolayers.
Figure 2
Figure 2
Semilog plot of J vs V for EGaIn/Ga2O3//OPE/AuTS junctions: OPE1 (black), OPE2 (red), OPE3 (blue), and OPE4 (dark cyan). (A) Data collected in ambient conditions. (B) Data collected in a flowbox environment of N2, 1–3% O2 and RH < 15%. Error bars are per-junction confidence intervals calculated using α = 0.95.
Figure 3
Figure 3
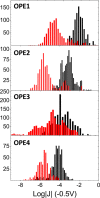
Histograms of all J/V data for OPE1, OPE2, OPE3, and OPE4 in ambient (red) and in the flowbox environment (black) at −0.5 V. y-axes are counts. The histograms in ambient environment are broad, and the peak values show no obvious trend, while the histograms in the flowbox are sharp and the peaks follow a clear trend with molecular length.
Figure 4
Figure 4
Arrhenius plots of low-bias conductance vs temperature for junctions comprising OPE3 (blue ▲) and OPE4 (dark cyan ▼). The invariance with temperature is characteristic of tunneling transport and indicates a lack of thermally activated processes. The low-bias conductance is reported as the slope of the JV traces in the 0.1 V/–0.1 V window. Data are shown down to the temperatures at which the majority of the junctions failed. Full JV traces are shown in Figure S2.
Figure 5
Figure 5
Formation of tips of EGaIn in ambient conditions (top) and in a flowbox kept at 2.5% O2, RH < 15% (bottom). The yellow scale bar is 500 μm. Although the process of necking into an hourglass shape and severing into sharp tips is the same in both cases, in the flowbox EGaIn does not wet the metallic syringe needle.
Figure 6
Figure 6
Plots of ln J @ +0.5 V vs molecular length in Å for AgTS/SAM//EGaIn junctions comprising CH3(CH2)9SH, CH3(CH2)11SH, CH3(CH2)13SH, and CH3(CH2)15SH. The data collected in the flowbox environment (N2 atmosphere with 1–3% O2, RH < 15%) are reported in red, while those obtained in ambient conditions are in black. Error bars are per-junction confidence intervals calculated using α = 0.95. The straight lines are linear fits of the data.
Figure 7
Figure 7
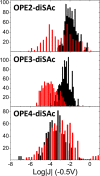
Histograms of all J/V data for diSAc-OPE2 (top), diSAc-OPE3 (middle), and diSAc-OPE4 (bottom) in ambient (red) and in the flowbox environment (black; N2 atmosphere with 1–3% O2, RH < 15%) at −0.5 V. y-axes are counts. The data acquired in air and characterized by broad distributions with no obvious trend while the data acquired in the flowbox are distributed more narrowly and the peak values follow a clear trend with molecular length.
Figure 8
Figure 8
Plots of ln |J| @0.5 V vs molecular length in Å for AuTS/SAM//EGaIn junctions formed from mono- (black) and di- (red) thioacetate derivatives of OPEs of varying length in the flowbox environment (structures are shown in Figure 1). Error bars are per-junction confidence intervals calculated using α = 0.95. The straight lines are linear fits of the data.

References

    1. Khan M. R.; Eaker C. B.; Bowden E. F.; Dickey M. D. Giant and Switchable Surface Activity of Liquid Metal via Surface Oxidation. Proc. Natl. Acad. Sci. U. S. A. 2014, 111, 14047–14051. 10.1073/pnas.1412227111. - DOI - PMC - PubMed
    1. Khan M. R.; Trlica C.; Dickey M. D. Recapillarity: Electrochemically Controlled Capillary Withdrawal of a Liquid Metal Alloy From Microchannels. Adv. Funct. Mater. 2015, 25, 671–678. 10.1002/adfm.201403042. - DOI
    1. Tang S.-Y.; Lin Y.; Joshipura I. D.; Khoshmanesh K.; Dickey M. D. Steering Liquid Metal Flow in Microchannels Using Low Voltages. Lab Chip 2015, 15, 3905–3911. 10.1039/C5LC00742A. - DOI - PubMed
    1. Wu Z.; Hjort K.; Jeong S. H. Microfluidic Stretchable Radio-Frequency Devices. Proc. IEEE 2015, 103, 1211–1225. 10.1109/JPROC.2015.2395716. - DOI
    1. Cademartiri L.; Thuo M. M.; Nijhuis C. A.; Reus W. F.; Tricard S.; Barber J. R.; Sodhi R. N. S.; Brodersen P.; Kim C.; Chiechi R. C.; et al. Electrical Resistance of AgTS–S(CH2)N–1CH3//Ga2O3/EGaIn Tunneling Junctions. J. Phys. Chem. C 2012, 116, 10848–10860. 10.1021/jp212501s. - DOI

LinkOut - more resources