. 2016 Dec 15;76(24):7194-7207.
doi: 10.1158/0008-5472.CAN-16-0714. Epub 2016 Oct 14.

Ubiquitous Release of Exosomal Tumor Suppressor miR-6126 from Ovarian Cancer Cells

Affiliations

Ubiquitous Release of Exosomal Tumor Suppressor miR-6126 from Ovarian Cancer Cells

Pinar Kanlikilicer et al. Cancer Res. .

Erratum in

Abstract

Cancer cells actively promote their tumorigenic behavior by reprogramming gene expression. Loading intraluminal vesicles with specific miRNAs and releasing them into the tumor microenvironment as exosomes is one mechanism of reprogramming whose regulation remains to be elucidated. Here, we report that miR-6126 is ubiquitously released in high abundance from both chemosensitive and chemoresistant ovarian cancer cells via exosomes. Overexpression of miR-6126 was confirmed in healthy ovarian tissue compared with ovarian cancer patient samples and correlated with better overall survival in patients with high-grade serous ovarian cancer. miR-6126 acted as a tumor suppressor by directly targeting integrin-β1, a key regulator of cancer cell metastasis. miR-6126 mimic treatment of cancer cells resulted in increased miR-6126 and decreased integrin-β1 mRNA levels in the exosome. Functional analysis showed that treatment of endothelial cells with miR-6126 mimic significantly reduced tube formation as well as invasion and migration capacities of ovarian cancer cells in vitro Administration of miR-6126 mimic in an orthotopic mouse model of ovarian cancer elicited a relative reduction in tumor growth, proliferating cells, and microvessel density. miR-6126 inhibition promoted oncogenic behavior by leading ovarian cancer cells to release more exosomes. Our findings provide new insights into the role of exosomal miRNA-mediated tumor progression and suggest a new therapeutic approach to disrupt oncogenic phenotypes in tumors. Cancer Res; 76(24); 7194-207. ©2016 AACR.


Conflict of interest statement

Conflict of Interest: The authors have no conflicts of interest to disclose.

Figures

Figure 1
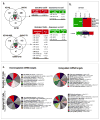
Figure 1. Analysis of microRNAs in cancer exosomes and their cells of origin
a. Common miRNAs were significantly differentially expressed between exosomes and their cell of origin for chemosensitive parental ovarian cancer cells (upper) and chemoresistant ovarian cancer cells (lower). FC, fold change. b. z-scores of miR-6126 (Supplementary Table 3) in six different cancer exosomes and their cells of origin. The rows represent individual ovarian cancer cell lines, and the columns represent the cellular compartments of miR-6126 expression. Negative z-scores are shown in green, positive z-scores in red. c. KEGG pathway analysis of the target mRNAs of significantly differentially regulated miRNAs in common for both sensitive ovarian cancer cells (upper panel; HeyA8, SKOV3-ip1, A2780) and resistant ovarian cancer cells (bottom panel; HeyA8-MDR, SKOV3-TR, A2780-CP20). OC, ovarian cancer
Figure 2
Figure 2. miR-6126 expression in exosomes from cancer cells and in patient tissue
a. qPCR validation of miR-6126 and miR-30c-5p expression in exosomes and cells of origin for all cancer cell lines used in the microarray experiment. b. Comparison of miR-6126 expression in exosomes derived from ovarian cancer cells and in exosomes derived from immortalized normal human ovarian surface epithelial cells (HIO180) by qPCR. c. Low expression of miR-6126 was associated with shorter survival in patients with ovarian cancer, as shown by Kaplan-Meier analysis of miR-6126 expression data extracted from the ArrayExpress database (p <0.05). Cut-off points to significantly split (log-rank test p-value <0.05) the samples into low/high mRNA/miRNA groups were recorded. The minimum p-values were chosen as cut-offs to optimally separate the patients in high/low groups. The cut-off for ITGB1 (ILMN_1723467) was 0.3 and for miR-6126, 0.61. d. miR-6126 expression in normal ovarian tissues (n=6) and ovarian tumors (n=19) from patients. *p <0.05, **p <0.01, ***p <0.001, ****p <0.0001.
Figure 3
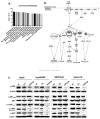
Figure 3. Proteomic effect of miR-6126 in ovarian cancer cells
a. Ingenuity Pathway Analysis of the canonical pathways most enriched in the proteins significantly altered by ectopic expression of miR-6126 in HeyA8 cells; the y-axis indicates the −log10 (p-value) of each enriched pathway. The Fisher exact test was used to calculate p-value. b. The PI3K/AKT signaling pathway. Proteins downregulated by miR-6126 transfection in ovarian cancer cells are colored in gray. c. Immunoblotting for PI3K/AKT signaling proteins in HeyA8, HeyA8-MDR, SKOV3-ip1, and SKOV3-TR ovarian cancer cells transfected with control miRNA or miR-6126 or no transfection (NT).
Figure 4
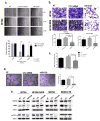
Figure 4. miR-6126 suppressed migration, invasion, and tube formation of HeyA8 and HeyA8-MDR ovarian cancer cells in vitro
a. Representative images of in vitro wound healing assay of HeyA8 ovarian cancer cells. Cells were seeded onto six-well plates and either not transfected (NT) or transfected with control miRNA mimic or miR-6126 mimic. Wound repair was monitored for 24 h and visualized under microscopy. Images were taken immediately after the scratch was made (t=0 h) and after 8, 12, and 20 h. All images shown are representative of three independent experiments; data are presented as mean ± SD of at least three experimental groups. b. HeyA8 cells and HeyA8-MDR cells were transfected with control miRNA mimic or miR-6126 mimic. Cells were incubated for 24 h and invasion was assessed by the transwell assay. All images shown are representative of three independent experiments; data are presented as mean ± SD of at least three experimental groups. c. In vitro EdU proliferation assay results for HeyA8 cells transfected with control miRNA mimic or miR-6126 mimic. The transfected cells were incubated 72 h later with EdU-containing medium for 2 h, and EdU incorporation was measured by flow cytometry. Data are presented as mean ± SD of at least three experimental groups d. miR-6126 suppressed tube formation in EC-RF24 cells in vitro. Transfected EC-RF24 cells were transferred to eight-well culture slides coated with matrigel (200 μL/well). After 24 h, the nodes in each culture were counted. All images shown are representative of three independent experiments; data are presented as mean ± SD of at least three experimental groups. e. Western blot analysis showing levels of angiogenesis-related proteins in HeyA8, HeyA8-MDR, SKOV3-ip1, and SKOV3-TR ovarian cancer cells transfected with control miRNA mimic or miR-6126 mimic. *p <0.05; **p <0.01; ***p<0.001.
Figure 5
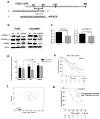
Figure 5. Integrin β-1 is a direct target of miR-6126
a. The predicted binding site for miR-6126 in the 3′-UTR of the integrin β-1 gene ITGB1. b. Western blot analysis showed the effects of miR-6126 transfection on levels of integrin β-1 protein in HeyA8 and HeyA8-MDR cells. NT, not transfected. c. Expression levels of ITGB1 were determined by qPCR in HeyA8 and HeyA8-MDR cells transfected with miR-6126 mimic. d. Firefly luciferase activity in HEK cells co-transfected with a wild-type (WT) or mutant ITGB1 transcript and with control miRNA mimic or miR-6126 mimic. Data were normalized to Renilla luciferase activity. Data are presented as mean ± SD of two biological replicates and three technical replicates. e. Association of overall survival (OS) in ovarian cancer patients with ITGB1 expression. f. miR-6126 expression was negatively correlated with ITGB1 expression. g. The combination of ITGB1/miR6126 gave a better separation than ITGB1 alone or miR-6126 alone for predicting overall survival. *p <0.05; **p <0.01; ****p <0.0001.
Figure 6
Figure 6. Exosome release is regulated by miR-6126 in SKOV3-ip1 ovarian cancer cells
a. Treatment with miR-6126 inhibitor led to increased exosome release in SKOV3-ip1 ovarian cancer cells. SKOV3-ip1 cells were transfected with miRNA mimics (control [CTL] or miR-6126) or miRNA inhibitors at a final concentration of 100 nM. After 24 h, the medium was replaced by exosome-depleted medium. After another 48 h, supernatants were collected and exosomes were isolated using exosome isolation reagent. Particles per milliliter were quantified by Nanosight. Data are presented as mean ± SD of at least two experimental groups. NT, not transfected. b. Modal ± SD particle diameter (left) did not differ significantly for exosomes released from cells transfected with control inhibitor/mimic or miR-6126 inhibitor/mimic or negative controls (p >0.05). c. miR-6126 expression level in exosomes which were isolated from CTL miRNA or miR-6126 transfected or not transfected SKOV3-ip1 cells. d. ITGB1 mRNA expression levels in exosomes which were isolated from CTL miRNA or miR-6126 transfected or not transfected SKOV3-ip1 cells. ITGB1 mRNA levels were compared in exosomes isolated from HIO180 (normal) or SKOV3-ip1 ovarian cancer cells. *p <0.05; **p <0.01
Figure 7
Figure 7. miR-6126 mimic treatment reduced tumor growth and vasculature in HeyA8 mouse model
a. (Left) Sizes of tumors obtained from representative mice treated with liposomes containing control miRNA mimic or miR-6126 mimic are shown. (Right) Tumor weights for groups treated with control miRNA mimic or miR-6126 mimic were significantly different (p <0.05, Mann-Whitney-Wilcoxon test). The normality of the distribution was tested by the Shapiro-Wilk test. b. Mouse body weights for the groups treated with control miRNA or miR-6126 at the end of the treatment period (p=0.857). c. Immunohistochemical staining of markers of proliferating cells (Ki67) and tumor vessel endothelial cells (CD31) in tumors from mice treated with control miRNA mimic or miR-6126 mimic. *p <0.05

References

    1. Johnstone RM, Adam M, Hammond JR, Orr L, Turbide C. Vesicle formation during reticulocyte maturation. Association of plasma membrane activities with released vesicles (exosomes) J Biol Chem. 1987;262:9412–20. - PubMed
    1. Valadi H, Ekstrom K, Bossios A, Sjostrand M, Lee JJ, Lotvall JO. Exosome-mediated transfer of mRNAs and microRNAs is a novel mechanism of genetic exchange between cells. Nat Cell Biol. 2007;9:654–9. - PubMed
    1. Braicu C, Tomuleasa C, Monroig P, Cucuianu A, Berindan-Neagoe I, Calin GA. Exosomes as divine messengers: are they the Hermes of modern molecular oncology? Cell Death Differ. 2015;22:34–45. - PMC - PubMed
    1. Abusamra AJ, Zhong Z, Zheng X, Li M, Ichim TE, Chin JL, et al. Tumor exosomes expressing Fas ligand mediate CD8+ T-cell apoptosis. Blood Cells Mol Dis. 2005;35:169–73. - PubMed
    1. Yang L, Wu XH, Wang D, Luo CL, Chen LX. Bladder cancer cell-derived exosomes inhibit tumor cell apoptosis and induce cell proliferation in vitro. Molecular medicine reports. 2013;8:1272–8. - PubMed

Publication types