

Targeting key angiogenic pathways with a bispecific CrossMAb optimized for neovascular eye diseases
- PMID: 27742718
- PMCID: PMC5090659
- DOI: 10.15252/emmm.201505889
Targeting key angiogenic pathways with a bispecific CrossMAb optimized for neovascular eye diseases
Erratum in
-
Targeting key angiogenic pathways with a bispecific CrossMAb optimized for neovascular eye diseases.EMBO Mol Med. 2019 May;11(5):e10666. doi: 10.15252/emmm.201910666. EMBO Mol Med. 2019. PMID: 31040127 Free PMC article.
Expression of concern in
-
Targeting key angiogenic pathways with a bispecific CrossMAb optimized for neovascular eye diseases.EMBO Mol Med. 2017 Jul;9(7):985. doi: 10.15252/emmm.201707895. EMBO Mol Med. 2017. PMID: 28533211 Free PMC article.
Abstract
Anti-angiogenic therapies using biological molecules that neutralize vascular endothelial growth factor-A (VEGF-A) have revolutionized treatment of retinal vascular diseases including age-related macular degeneration (AMD). This study reports preclinical assessment of a strategy to enhance anti-VEGF-A monotherapy efficacy by targeting both VEGF-A and angiopoietin-2 (ANG-2), a factor strongly upregulated in vitreous fluids of patients with retinal vascular disease and exerting some of its activities in concert with VEGF-A. Simultaneous VEGF-A and ANG-2 inhibition was found to reduce vessel lesion number, permeability, retinal edema, and neuron loss more effectively than either agent alone in a spontaneous choroidal neovascularization (CNV) model. We describe the generation of a bispecific domain-exchanged (crossed) monoclonal antibody (CrossMAb; RG7716) capable of binding, neutralizing, and depleting VEGF-A and ANG-2. RG7716 showed greater efficacy than anti-VEGF-A alone in a non-human primate laser-induced CNV model after intravitreal delivery. Modification of RG7716's FcRn and FcγR binding sites disabled the antibodies' Fc-mediated effector functions. This resulted in increased systemic, but not ocular, clearance. These properties make RG7716 a potential next-generation therapy for neovascular indications of the eye.
Keywords: Fc receptor; age‐related macular degeneration; angiogenesis; angiopoietin‐2; vascular endothelial growth factor.
© 2016 F. Hoffmann‐La Roche Ltd. Published under the terms of the CC BY 4.0 license.
Figures
- A, B
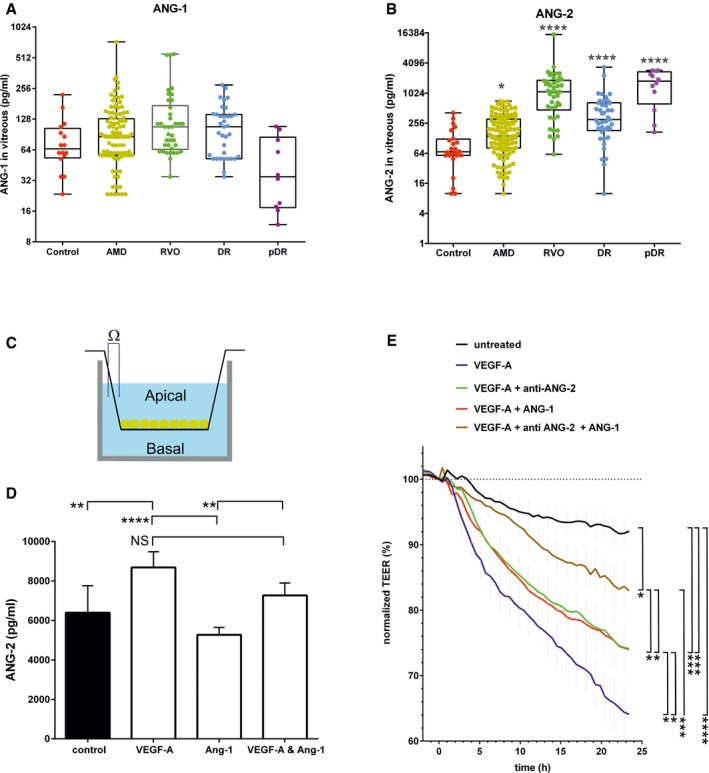
Box plots of vitreal ANG‐1 (A) and ANG‐2 (B) levels from newly diagnosed patients with wAMD, DR, proliferative DR and RVO compared to controls (macular hole). The interquartile range of the data is indicated by the box. A nonparametric Kruskal–Wallis analysis followed by Dunn's method for multiple comparisons was used to show significant differences of the groups to control which are indicated by asterisks. ANG‐1 levels did not differ significantly, but ANG‐2 levels were significantly different: control vs. AMD (*, P = 0.0451), vs. DR (****, P < 0.0001), pDR (****, P < 0.0001), and RVO (****, P < 0.0001).
- C
Schematic of cellular experiments to measure transendothelial resistance in human endothelial cells using transwell filters and CellZscope technology.
- D
24‐h concentration of ANG‐2 in supernatants of the basal side of the culture stimulated with 5 ng/ml of VEGF‐A, 200 ng/ml of ANG‐1, or the combination. Error bars show SEM with one‐sided ANOVA (P < 0.0001) and Tukey's multiple t‐test for five independent experiments indicating significance for control vs. VEGF‐A (**, P = 0.0028); VEGF‐A vs. ANG‐1 (****, P < 0.0001); ANG‐1 vs. VEGF‐A and ANG1 (**, P = 0.0061); VEGF‐A vs. VEGF‐A and ANG‐1 (ns, P = 0.0625).
- E
Human endothelial cells plated on filters were assessed for endothelial barrier function over time after the addition of 5 ng/ml VEGF‐A alone or in combination with 200 ng/ml ANG‐1 or 10 μg/ml anti‐ANG‐2 or all three test items. The final time point was used for statistical analysis. Error bars show SEM with one‐sided ANOVA (P < 0.0001) and Tukey's multiple t‐test for three independent experiments indicating significance of VEGF‐A vs. untreated (****, P < 0.0001); vs. VEGF‐A and ANG‐1 and anti‐ANG‐2 (***, P = 0.0004); vs. VEGF‐A and anti‐ANG‐2 (*, P = 0.038); vs. VEGF‐A and ANG‐1 (*, P = 0.040). Furthermore, VEGF‐A and anti‐ANG‐2 and ANG‐1 are significantly different vs. VEGF‐A and ANG‐1 (*, P = 0.0451); vs. VEGF‐A and anti‐ANG‐2 (*, P = 0.0474); vs. untreated (*, P = 0.0492). Finally untreated is significantly different vs. VEGF‐A and ANG‐1 (***, P = 0.0009) and VEGF‐A and anti‐ANG‐2 (***, P = 0.0008).
- A, B
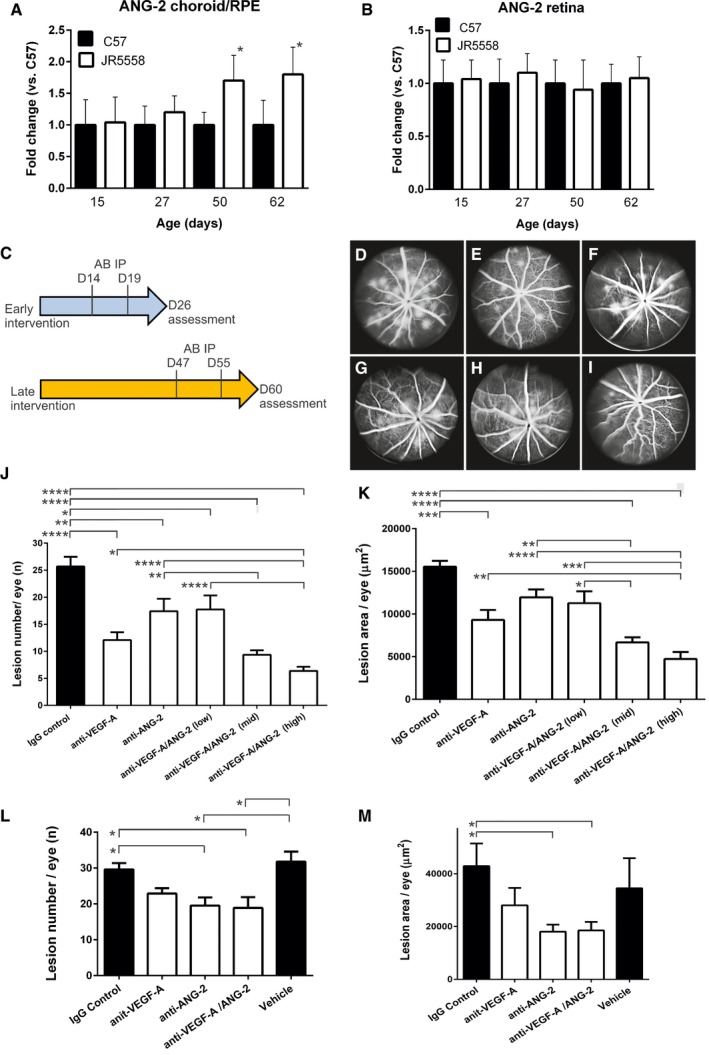
Real‐time qPCR analysis of ANG‐2 levels in retina and RPE/choroid complexes of JR5558 and C57BL/6J (C57) mice. (A) Relative expression levels of ANG‐2 were significantly increased in the RPE/choroid complexes of JR5558 mice in comparison with C57, at 50 and 62 days old (*, P = 0.022 at D50 and *, P = 0.042 at D62). (B) By contrast, retina levels of ANG‐2 were not significantly different between C57 and JR5558 mice, indicating neovascularization is driven locally by ANG‐2. Asterisk (*) denotes statistical significance of JR5558 mice compared to wild‐type C57BL/6 using unpaired t‐test for each time point analyzed separately.
- C
Schematic presentation of experimental design. Mice received IP injections of CrossMAb anti‐VEGF‐A/ANG‐2 (species crossreactive, B20‐4.1 and LC10), anti‐ANG‐2 (LC10), an anti‐VEGF‐A IgG1 (B20‐4.1), or IgG control at postnatal D14 and D19 followed by fluorescence angiography at D26 (early intervention), results demonstrated in (D–K). Alternatively, mice received antibody at postnatal D47 and D55 followed by fluorescence angiography at D60 (late intervention), results demonstrated in (L) and (M).
- D–I
Representative examples of fluorescence angiograms of IgG control (D), anti‐VEGF‐A (E), anti‐ANG‐2 (F) (all at 5 mg/kg), and three doses of anti‐VEGF‐A/ANG‐2 (G, H, and I) (at 3, 5, and 10 mg/kg).
- J, K
Bar graph of numbers of spontaneously occurring lesions (J) and area by fluorescence angiography (K) after two weekly doses of antibody (antibodies at 5 mg/kg IP and anti‐VEGF‐A/ANG‐2 at 10 [high], 5 [mid], and 3 [low] mg/kg IP) followed by analysis a week later in the early intervention model.
- L, M
Bar graph of numbers of spontaneously occurring lesions (L) and area by fluorescence angiography (M) after two weekly doses of antibody (3 mg/kg IP) followed by analysis a week later in the late intervention model.
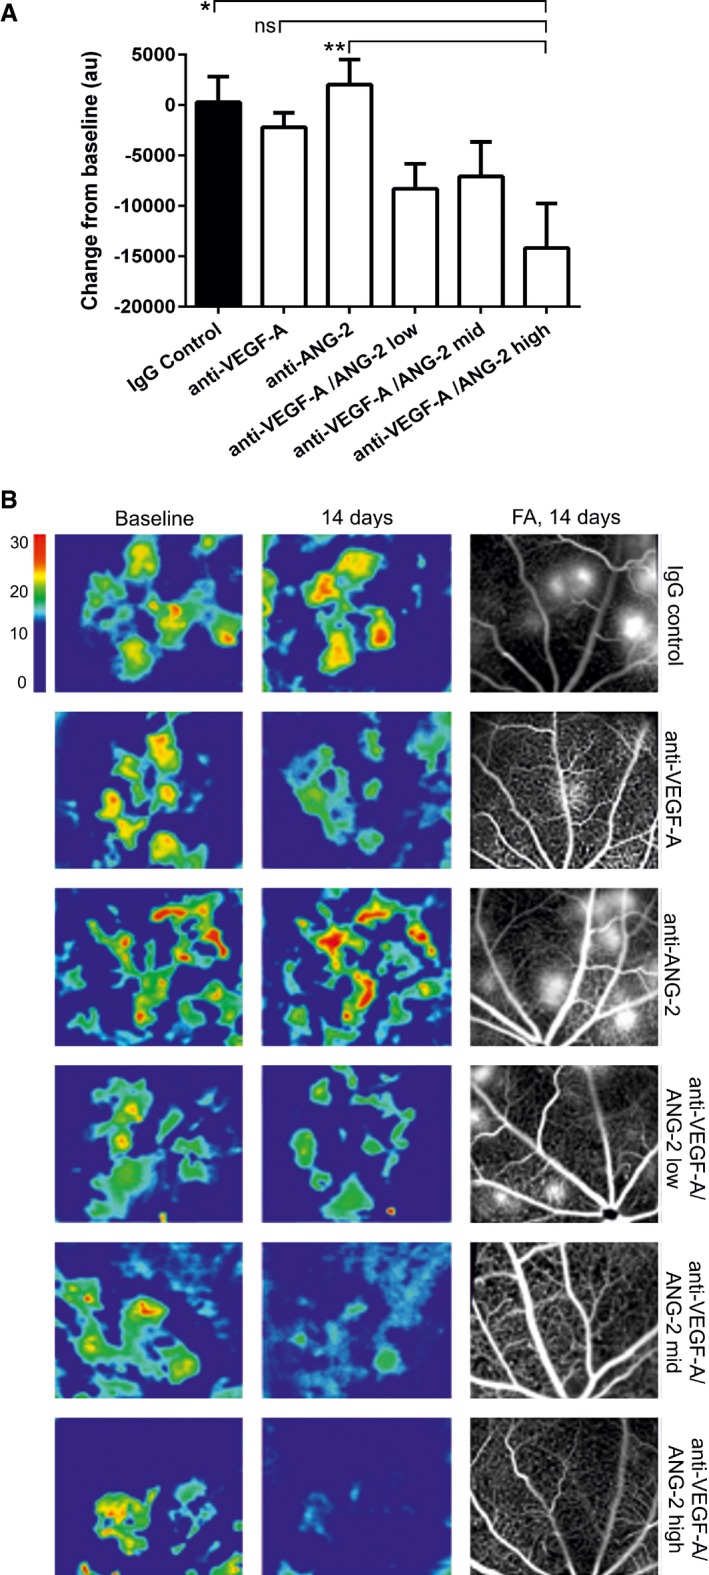
Bar graph showing the relative change in OCT‐measured volume between the outer nuclear layer and the RPE layer following intervention with test item. anti‐VEGF‐A and anti‐ANG‐2 were given at 5 mg/kg and anti‐VEGF‐A/ANG‐2 at 1, 5, and 10 mg/kg (low, mid, and high dose).
Representative OCT images converted to heat maps with the scaling grade given on the right of the figure delineating fluid‐filled areas of the retina. Baseline (D46) and 14‐day treatments of IgG control, Anti‐VEGF‐A, anti‐ANG‐2, and bispecific anti‐VEGF‐A/ANG‐2 at the end of the experiment (D60) are shown. For the region of interest, the corresponding FA image at D60 is also shown as comparator.
- A
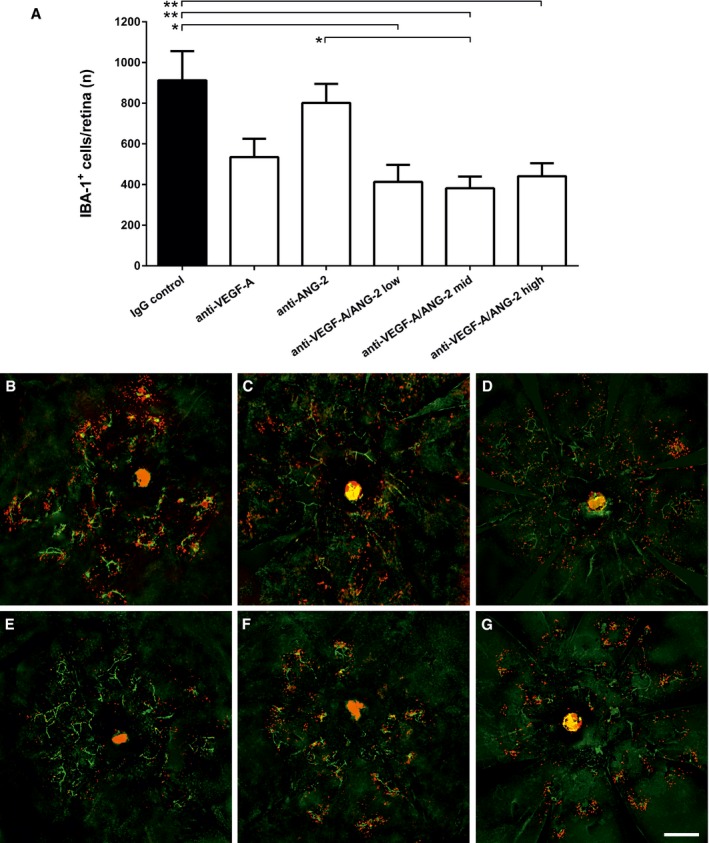
Bar graph of number of IBA‐1+ cells in the retina of mice treated with IgG control, anti‐VEGF‐A, anti‐ANG‐2 (all 5 mg/kg IP), or bispecific anti‐VEGF‐A/ANG‐2 (at 10, 5, and 3 mg/kg) in the late interference model at D60. Error bars show SEM with n = 6 animals per group. All significant differences are shown by * after one‐sided ANOVA (P < 0.0008) and Tukey's multiple t‐test. IgG control is significantly different vs. anti‐VEGF‐A/ANG‐2 low (*, P < 0.0134), mid (**, P < 0.0078), and high (**, P < 0.0042); furthermore, anti‐ANG‐2 is significantly different vs. anti‐VEGF‐A/ANG‐2 mid (*, P < 0.0353).
- B–G
(B) IgG control, (C) anti‐VEGF‐A, (D) anti‐ANG‐2, (E–G) anti‐VEGF‐A/ANG‐2 low, mid, and high: representative micrographs of whole‐mount eyecup preparations stained with isolectin‐B4 positive (green) to stain vessels and anti‐IBA1 (red) to stain for macrophages show a decrease in both absolute numbers and clustering of subretinal IBA‐1‐expressing cells associated with neovascular complexes in anti‐VEGF‐A/ANG‐2 treatment groups. Scale bar, 200 μm.
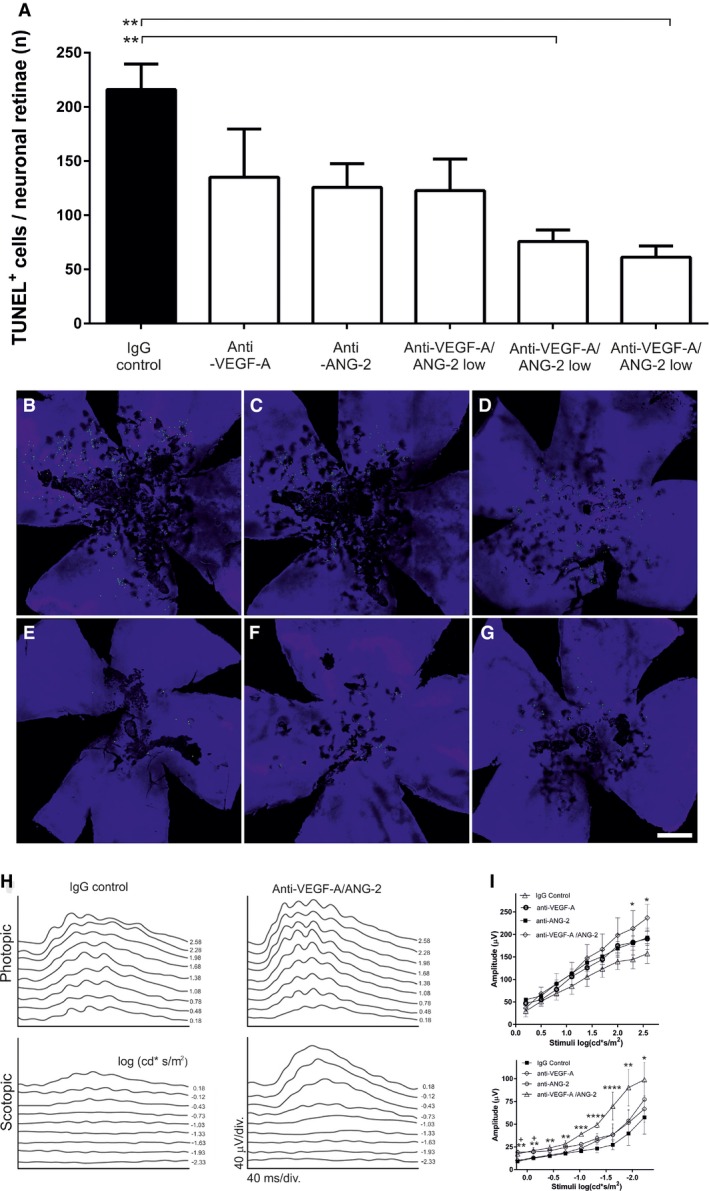
- A
Bar graph of TUNEL‐positive cells in the retina of mice treated with 5 mg/kg anti‐VEGF‐A, anti‐ANG‐2, and 3, 5, and 10 mg/kg anti‐VEGF‐A/ANG‐2. Error bars show SEM with n = 6 animals per group and * denotes all significant changes after one‐sided ANOVA (P = 0.0041) and Tukey's multiple t‐test. IgG control is significantly different from anti‐VEGF‐A/ANG‐2 mid (**, P = 0.0077) and high (**, P = 0.0028).
- B–G
(B) IgG control, (C) anti‐VEGF‐A, (D) anti‐ANG‐2, (E–G) anti‐VEGF‐A/ANG‐2 low, mid, and high: representative micrographs of whole‐mount retinae preparations display the reduction in TUNEL‐positive photoreceptor cells (green) clustered around focal neovascular lesions in anti‐VEGF‐A/ANG‐2 (E–G) and, to a lesser extent, anti‐VEGF‐A‐treated (C) and anti‐ANG‐2‐treated (D) groups compared with IgG‐treated controls (B) (scale bar, 200 μm).
- H
ERG was used to assess retinal function in response to large‐field flash stimuli under both scotopic and photopic conditions. Representative photopic (light‐adapted) and scotopic (dark‐adapted) flash response series show increased amplitude and reduced latency after treatment with bispecific anti‐VEGF‐A/ANG‐2 compared with IgG control (both 3 mg/kg). ERG shows reduced depression of B‐wave responses in JR5558 mice treated with anti‐VEGF‐A/ANG‐2 compared to IgG control.
- I
Maximum photopic ERG amplitude was increased using anti‐VEGF‐A/ANG‐2 compared to single anti‐VEGF‐A or anti‐ANG‐2 treatments (all at 3 mg/kg). There was a significant increase in amplitude at stimuli > 2 log (cd*s/m2) between the bispecific anti‐VEGF‐A/ANG‐2 and IgG control group under scoptopic and photopic conditions. Asterisk (*) denotes significance after ANOVA and Dunnett's multiple t‐test compared to IgG control compared for each stimuli separately; error bars show SEM with n = 8 animals per group. Under photopic conditions, anti‐VEGF‐A/ANG‐2 reached significance at 2.58 and 2.30 cd*s/m2 with *, P = 0.0498 and *, P = 0.0479, respectively. Under scotopic conditions, all stimuli reached significance for anti‐VEGF‐A/ANG‐2 at −2.3 cd*s/m2 (*, P = 0.0498); −1.93 cd*s/m2 (**, P = 0.0035); −1.63 and −1.33 cd*s/m2 (****, P < 0.0001); −1.03 cd*s/m2 (***, P = 0.0002); −0.73 cd*s/m2, (**, P = 0.004); −0.43 cd*s/m2, (**, P = 0.0024); −0.13 cd*s/m2 (**, P = 0.0024) and 0.18 cd*s/m2 (**, P = 0.0031). In addition, anti‐ANG‐2 treatment reached significance at −0.13 cd*s/m2 (+ P = 0.011) and 0.18 cd*s/m2 (+ P = 0.005), respectively.
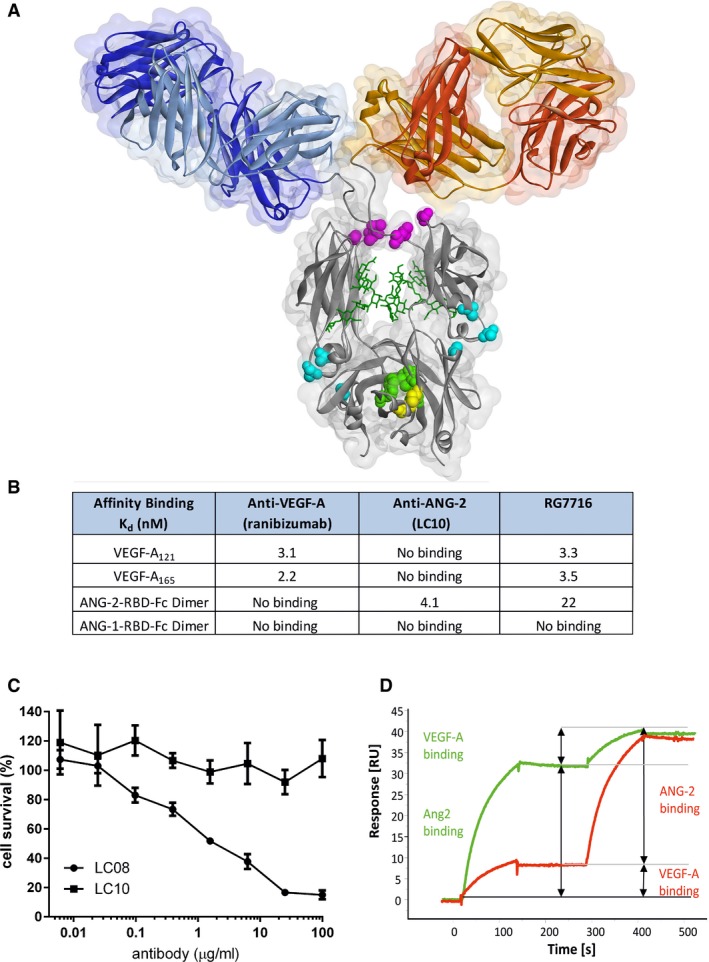
Structural presentation of CrossMAb RG7716 with substituted amino acids highlighted and colored. Amino acids corresponding to individual point mutations ensuring correct and efficient heavy chain heterodimerization (“knobs‐into‐holes” [green] and additional disulfide bridge [yellow]), abolishing Fc receptor functionality (Fcγ receptors I, II, and III, [pink] and FcRn [blue]) are highlighted.
Summary table of experimental binding affinities of the parental components targeting VEGF‐A (ranibizumab) and ANG‐2 (LC10) as well as of RG7716 measured by isothermal titration calorimetry. RG7716 binds VEGF‐A121 and VEGF‐A165 with an affinity comparable to ranibizumab (3.3 vs. 3.1 nM). ANG‐2 binding of RG7716 is slightly decreased to 22 nM compared to α‐ANG‐2 IgG1 (LC10) with 4.1 nM. No binding to ANG‐1 was detectable for RG7716 or α‐ANG‐2 IgG1 (LC10).
Inhibition of ANG‐1‐induced endothelial cell survival was tested in the presence of increasing concentrations of LC10 (anti‐ANG‐2 IgG, ANG‐2 binding part in RG7716) and LC08 (ANG‐1 and ANG‐2 binding antibody). An average of three independent experiments is shown with SEM.
The ability of RG7716 to bind to ANG‐2 and VEGF‐A simultaneously and independent is demonstrated by a surface plasmon resonance experiment. RG7716 is captured via an anti‐Fc antibody on the chip surface. The green curve depicts the experiment with ANG‐2 in the first and VEGF‐A in the second binding event. The red curve shows the binding events in the other sequence.
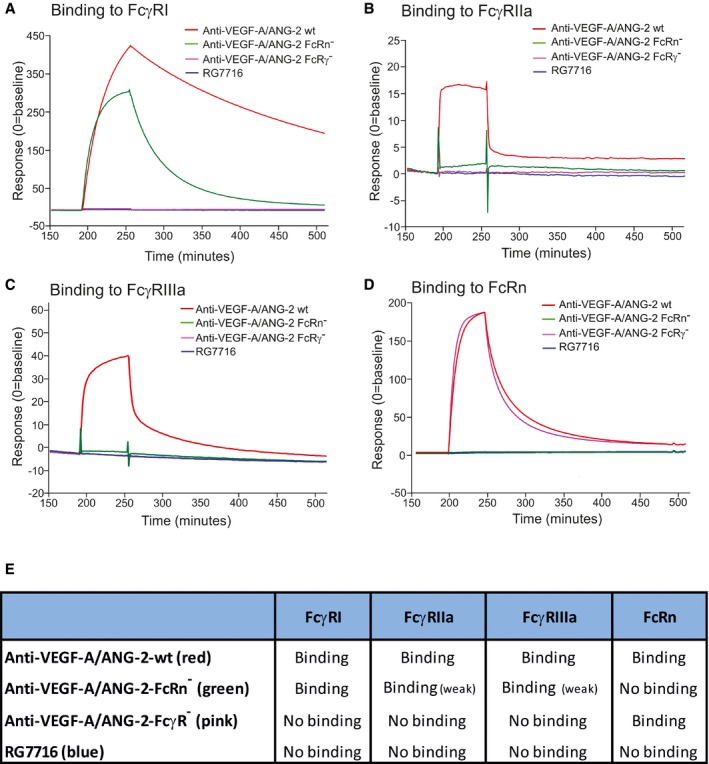
- A–D
Time‐dependent binding of RG7716 is shown in blue, anti‐VEGF‐A/ANG‐2 without modification of the Fc part in red (wild‐type), anti‐VEGF‐A/ANG‐2 with modification of the FcRn binding site only in green (FcRn−), and anti‐VEGF‐A/ANG‐2 with modification of the FcγR binding in pink (FcγR−). Panel (A) shows SPR binding profile over time to immobilized FcγRI, (B) to immobilized FcγRII, (C) to immobilized FcγRIII, and (D) to immobilized FcRn. SPR, surface plasmon resonance.
- E
Summary data table of binding data for RG7716 in comparison with anti‐VEGF‐A/ANG‐2 CrossMAbs without modifications in the Fc part.
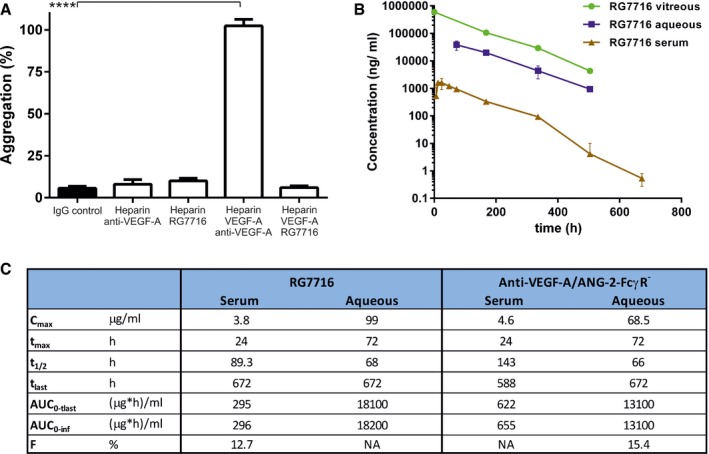
Bar graph demonstrating platelet aggregation induced by complexes of heparin, VEGF‐A165, and anti‐VEGF‐A (IgG1) in vitro using washed human platelets. Introduction of modification of the Fc region in RG7716 does not allow platelet aggregation to happen as compared to anti‐VEGF‐A as wild‐type IgG1. All three components are needed as heparin/anti‐VEGF‐A alone does not activate platelet aggregation. Error bars show SEM of three independent experiments and **** denotes significance of heparin/VEGF‐A/anti‐VEGF‐A comparing to IgG control using ANOVA (P < 0.0001) and Dunnett's multiple t‐test (****, P < 0.0001).
Kinetic presentation of mean serum, vitreous, and aqueous humor concentrations after single intravitreal administration of 0.5 mg of RG7716 in cynomolgus monkeys. Error bars indicate SEM with n = 6.
Summary table of key experimental PK parameters of RG7716 and anti‐VEGF‐A/ANG‐2‐FcγR− (with intact FcRn binding).
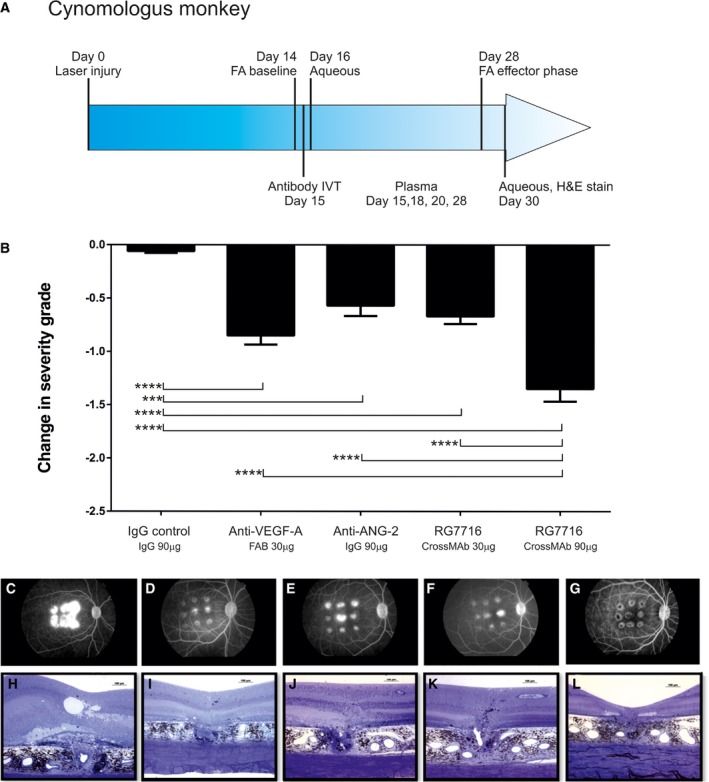
- A
Schematic representation of the experimental setup including treatment, sampling, and efficacy readouts.
- B
Inhibition of neovascularization measured in severity grades, change of severity from baseline is shown for each treatment; all treatment significantly reduced the severity grade compared to IgG control. In addition, efficacy of RG7716 (150‐kDa molecule at 90 μg/50 μl injected IVT) was significantly better at equal molar concentration of binding sites than anti‐VEGF‐A (ranibizumab, 50‐kDa molecule at 30 μg/50 μl injected IVT), anti‐ANG‐2, and the low dose of RG7716 (30 μg/50 ?l injected IVT). Error bars show SEM of n = 6 cynomolgus monkeys and nine spots per eye in the group; * denotes significance after one‐sided ANOVA and Tukey's multiple t‐test. IgG control is significantly different from anti‐VEGF‐A (****, P < 0.0001), anti‐ANG‐2 (***, P = 0.0003), RG7716, 30 μg (****, P < 0.0001), and RG7716, 90 μg (****, P < 0.0001). Furthermore, RG7716, 90 μg is significantly different from RG7716, 30 μg (****, P < 0.0001), anti‐ANG‐2 (***, P = 0.0003), and anti‐VEGF‐A (***, P < 0.0004).
- C–L
(C–G) Representative figures of fluorescence fundus angiograms (H–L) of cross sections of a hematoxylin staining of a spot at the end of the experiment from eyes treated with IgG control, anti‐VEGF‐A, anti‐ANG‐2, and RG7716 at 30 and 90 μg, respectively.
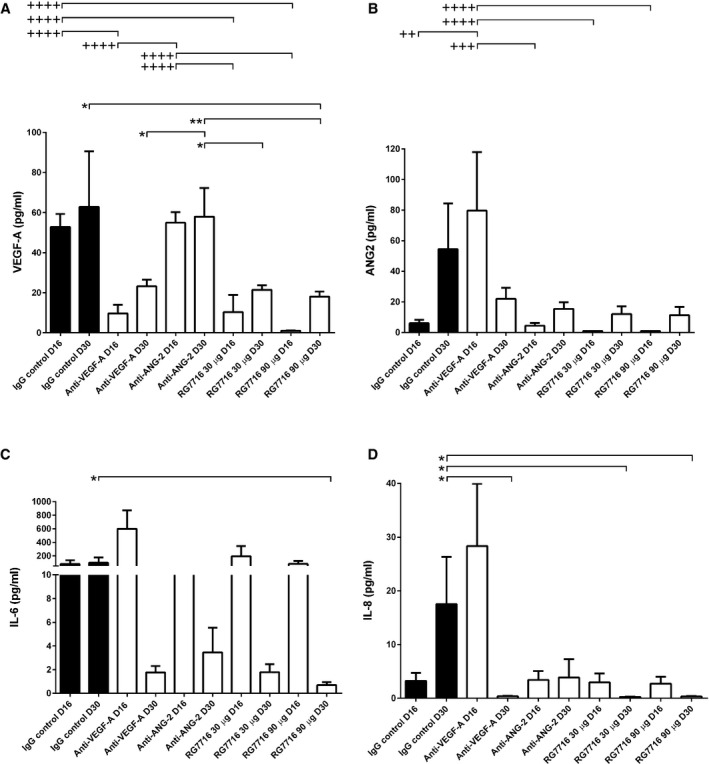
VEGF‐A levels only slightly increased from D16 to D30 in the IgG control. At D16, levels of IgG control are significantly higher compared to anti‐VEGF‐A (++++, P < 0.0001); RG7716, 30 μg (++++, P < 0.0001) and RG7716, 90 μg (++++, P < 0.0001). anti‐ANG‐2 levels are comparable to IgG control and therefore significantly different from anti‐VEGF‐A (++++, P < 0.0001); RG7716, 30 μg (++++, P < 0.0001) and RG7716, 90 μg (++++, P < 0.0001). At D30, the levels of VEGF‐A are significantly reduced in the RG7716, 90 μg group compared to IgG control (*, P = 0.0309). anti‐ANG‐2 remains at levels comparable to IgG control and is therefore significantly higher than RG7716, 30 μg (*, P = 0.0107), RG7716, 90 μg (**, P = 0.002), and anti‐VEGF‐A (*, P = 0.0162).
ANG‐2 levels increased from D16 to D30 in the IgG control. The same patterns, with a weaker total increase, were seen for the ANG‐2 and both RG7716 treatment groups. ANG‐2 levels were significantly higher at D16 in the anti‐VEGF‐A‐treated group compared to IgG control (++, P = 0.002), anti‐ANG‐2 (+++, P = 0.0004), RG7716, 30 μg (++++, P < 0.0001), and RG7716, 90 μg (++++, P < 0.0001). The reductions of treatments compared to IgG control at day 30 did not reach significance.
IL‐6 levels only very slightly increased from D16 to D30 in the IgG control, while for all other treatment groups there was a trend to reduced IL‐6 levels at D30 compared to baseline with the high dose of RG7716 reaching significance, IgG control vs. RG7716, 90 μg (*, P = 0.023).
IL‐8 levels increased from D16 to D30 in the IgG control group. Compared to the IgG control, the levels of IL‐8 were reduced in the anti‐VEGF‐A (*, P = 0.0262), RG7716, 30 μg (*, P = 0.0188), and RG7716, 90 μg (*, P = 0.0107) treatments at D30.
References
-
- Aguilar E, Dorrell MI, Friedlander D, Jacobson RA, Johnson A, Marchetti V, Moreno SK, Ritter MR, Friedlander M (2008) Chapter 6 Ocular models of angiogenesis. Methods Enzymol 444: 115–158 - PubMed
-
- Asahara T, Chen D, Takahashi T, Fujikawa K, Kearney M, Magner M, Yancopoulos GD, Isner JM (1998) Tie2 receptor ligands, angiopoietin‐1 and angiopoietin‐2, modulate VEGF‐induced postnatal neovascularization. Circ Res 83: 233–240 - PubMed
-
- Augustin HG, Koh GY, Thurston G, Alitalo K (2009) Control of vascular morphogenesis and homeostasis through the angiopoietin‐Tie system. Nat Rev Mol Cell Biol 10: 165–177 - PubMed
-
- Barton WA, Tzvetkova‐Robev D, Miranda EP, Kolev MV, Rajashankar KR, Himanen JP, Nikolov DB (2006) Crystal structures of the Tie2 receptor ectodomain and the angiopoietin‐2‐Tie2 complex. Nat Struct Mol Biol 13: 524–532 - PubMed
Publication types
MeSH terms
Substances
LinkOut - more resources
Full Text Sources
Other Literature Sources
Medical
Miscellaneous
