

Progression of brain atrophy in PSP and CBS over 6 months and 1 year
- PMID: 27742814
- PMCID: PMC5109951
- DOI: 10.1212/WNL.0000000000003305
Progression of brain atrophy in PSP and CBS over 6 months and 1 year
Abstract
Objective: To examine the utility and reliability of volumetric MRI in measuring disease progression in the 4 repeat tauopathies, progressive supranuclear palsy (PSP) and corticobasal syndrome (CBS), to support clinical development of new tau-directed therapeutic agents.
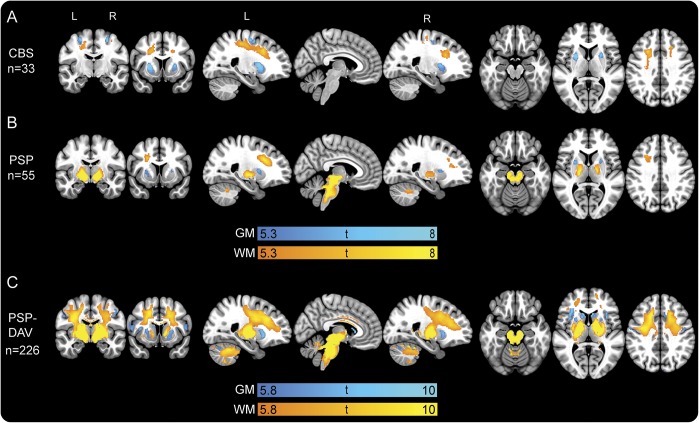
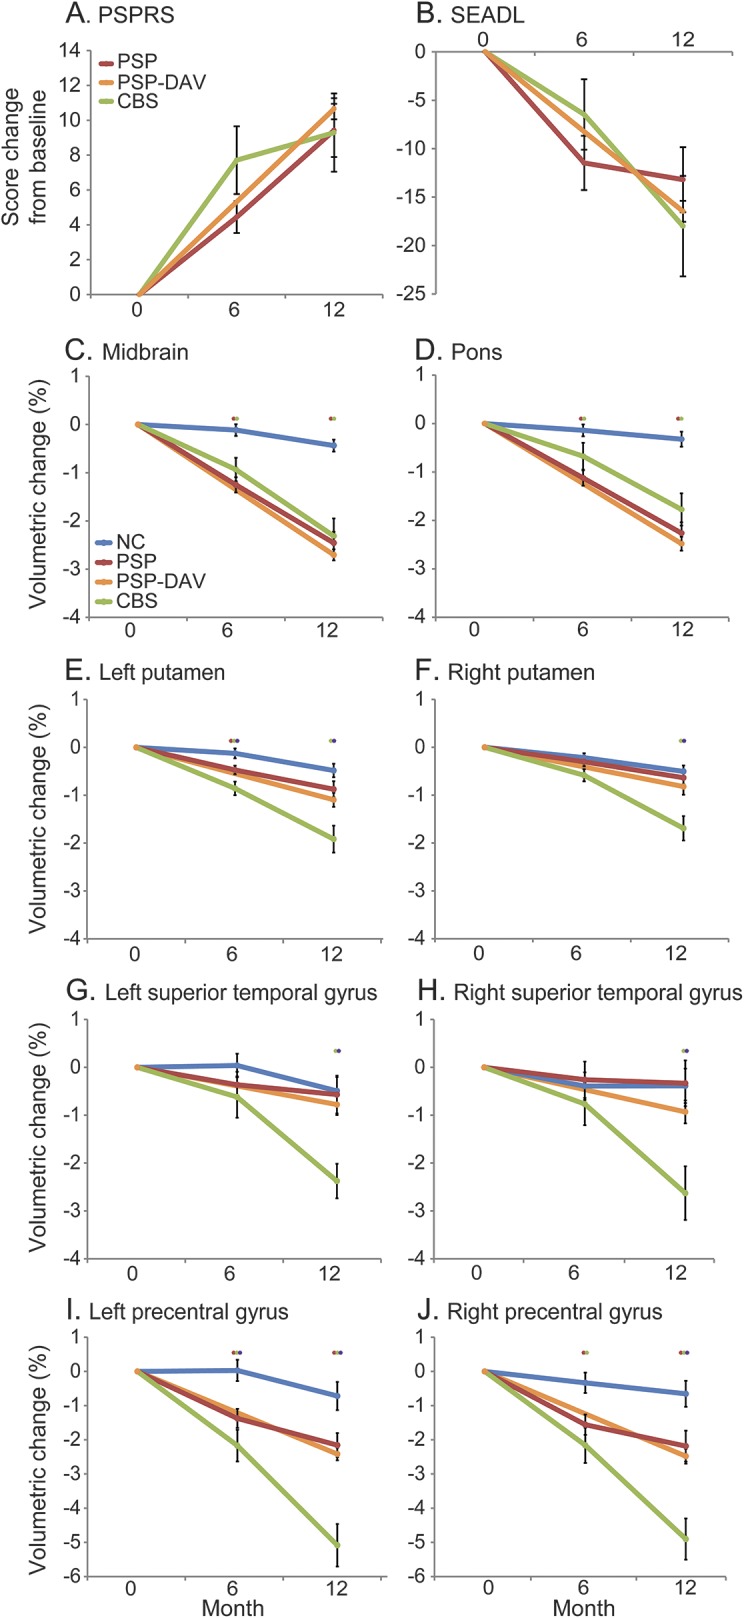
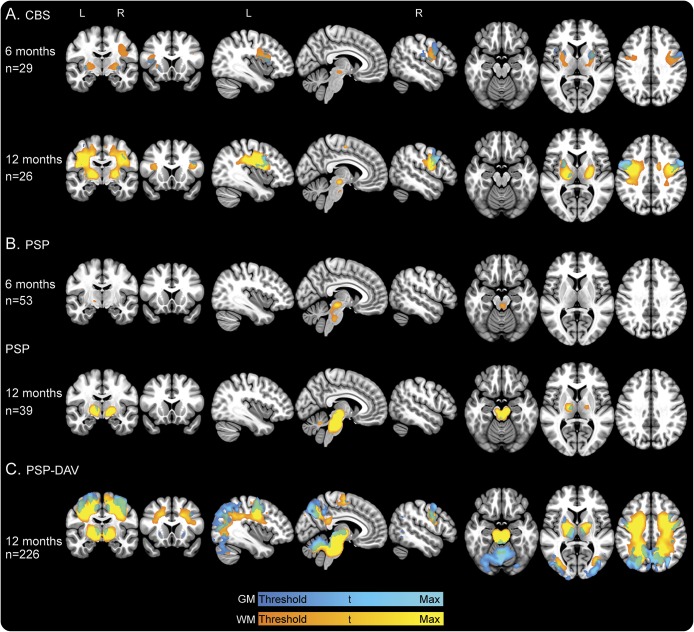
Methods: Six- and 12-month changes in regional MRI volumes and PSP Rating Scale scores were examined in 55 patients with PSP and 33 patients with CBS (78% amyloid PET negative) compared to 30 normal controls from a multicenter natural history study. Longitudinal voxel-based morphometric analyses identified patterns of volume loss, and region-of-interest analyses examined rates of volume loss in brainstem (midbrain, pons, superior cerebellar peduncle), cortical, and subcortical regions based on previously validated atlases. Results were compared to those in a replication cohort of 226 patients with PSP with MRI data from the AL-108-231 clinical trial.
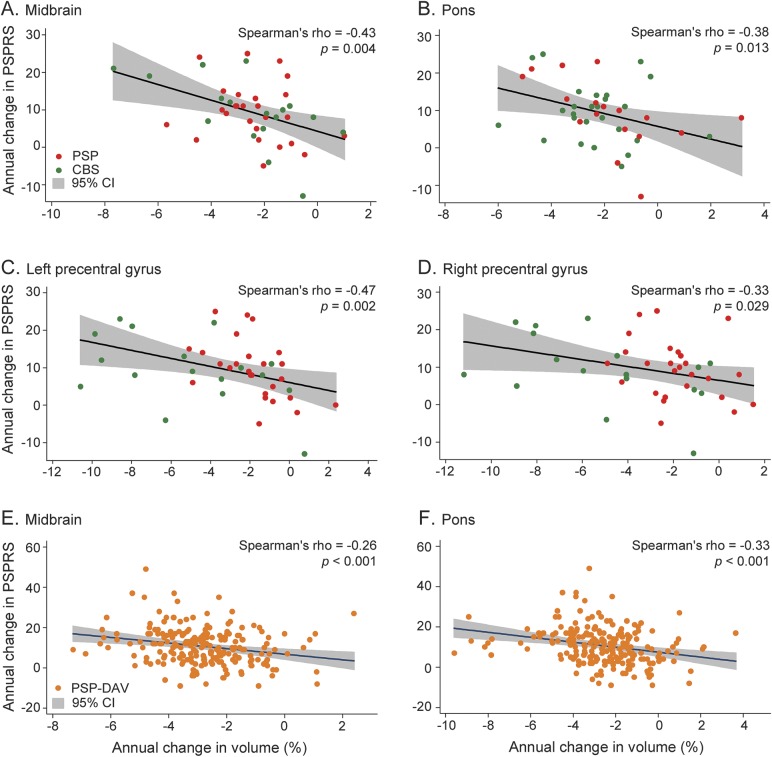
Results: Patients with CBS exhibited greater baseline atrophy and greater longitudinal atrophy rates in cortical and basal ganglia regions than patients with PSP; however, midbrain and pontine atrophy rates were similar. Voxel-wise analyses showed distinct patterns of regional longitudinal atrophy in each group as compared to normal controls. The midbrain/pons volumetric ratio differed between diagnoses but remained stable over time. In both patient groups, brainstem atrophy rates were correlated with disease progression measured using the PSP Rating Scale.
Conclusions: Volume loss is quantifiable over a period of 6 months in CBS and PSP. Future clinical trials may be able to combine CBS and PSP to measure therapeutic effects.
© 2016 American Academy of Neurology.
Figures
References
-
- Williams DR, Lees AJ. Progressive supranuclear palsy: clinicopathological concepts and diagnostic challenges. Lancet Neurol 2009;8:270–279. - PubMed
-
- Boxer AL, Geschwind MD, Belfor N, et al. . Patterns of brain atrophy that differentiate corticobasal degeneration syndrome from progressive supranuclear palsy. Arch Neurol 2006;63:81–86. - PubMed
-
- Groschel K, Hauser TK, Luft A, et al. . Magnetic resonance imaging–based volumetry differentiates progressive supranuclear palsy from corticobasal degeneration. Neuroimage 2004;21:714–724. - PubMed
-
- Groschel K, Kastrup A, Litvan I, Schulz JB. Penguins and hummingbirds: midbrain atrophy in progressive supranuclear palsy. Neurology 2006;66:949–950. - PubMed
-
- Soliveri P, Monza D, Paridi D, et al. . Cognitive and magnetic resonance imaging aspects of corticobasal degeneration and progressive supranuclear palsy. Neurology 1999;53:502–507. - PubMed
Publication types
MeSH terms
Grants and funding
- P01 AG017586/AG/NIA NIH HHS/United States
- R01 AG011378/AG/NIA NIH HHS/United States
- R01 AG032306/AG/NIA NIH HHS/United States
- R01 AG043392/AG/NIA NIH HHS/United States
- U54 NS092089/NS/NINDS NIH HHS/United States
- U01 AG006786/AG/NIA NIH HHS/United States
- R01 AG041851/AG/NIA NIH HHS/United States
- P50 AG023501/AG/NIA NIH HHS/United States
- K24 AG045333/AG/NIA NIH HHS/United States
- P50 AG005142/AG/NIA NIH HHS/United States
- U01 AG024904/AG/NIA NIH HHS/United States
- R01 AG038791/AG/NIA NIH HHS/United States
- R01 AG037551/AG/NIA NIH HHS/United States
- P01 AG019724/AG/NIA NIH HHS/United States
LinkOut - more resources
Full Text Sources
Other Literature Sources
Medical
Miscellaneous