. 2016 Nov 25;291(48):25217-25226.
doi: 10.1074/jbc.M116.751925. Epub 2016 Oct 14.

Modulating the Effects of the Bacterial Chaperonin GroEL on Fibrillogenic Polypeptides through Modification of Domain Hinge Architecture

Affiliations

Modulating the Effects of the Bacterial Chaperonin GroEL on Fibrillogenic Polypeptides through Modification of Domain Hinge Architecture

Naoya Fukui et al. J Biol Chem. .

Abstract

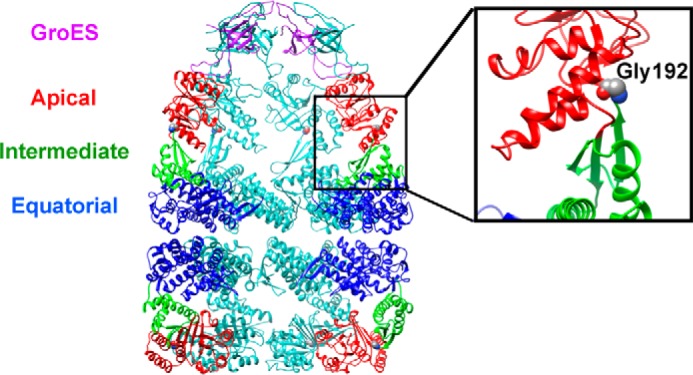
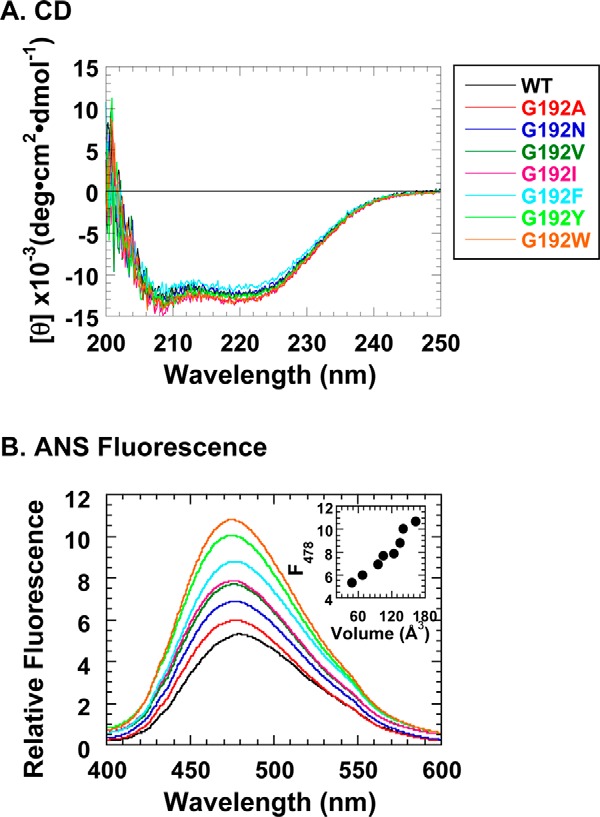
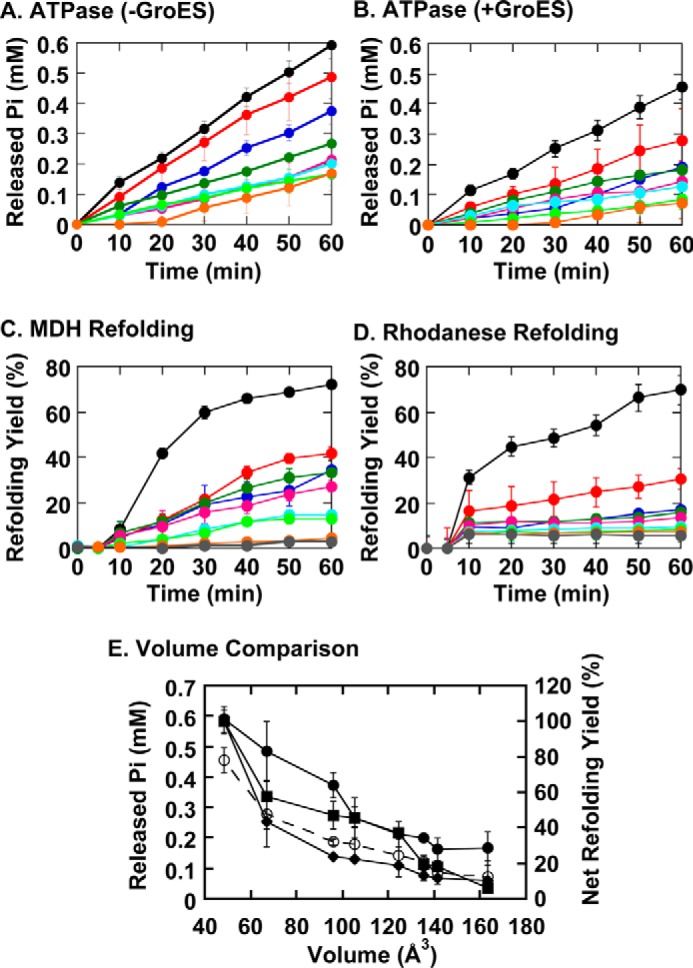
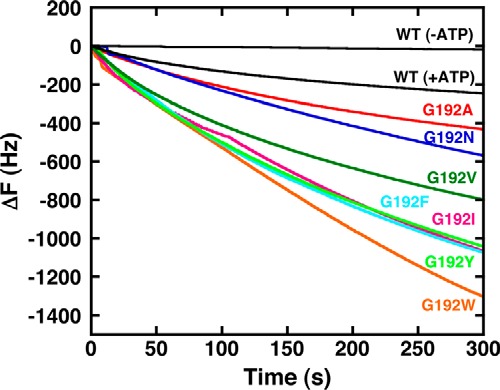
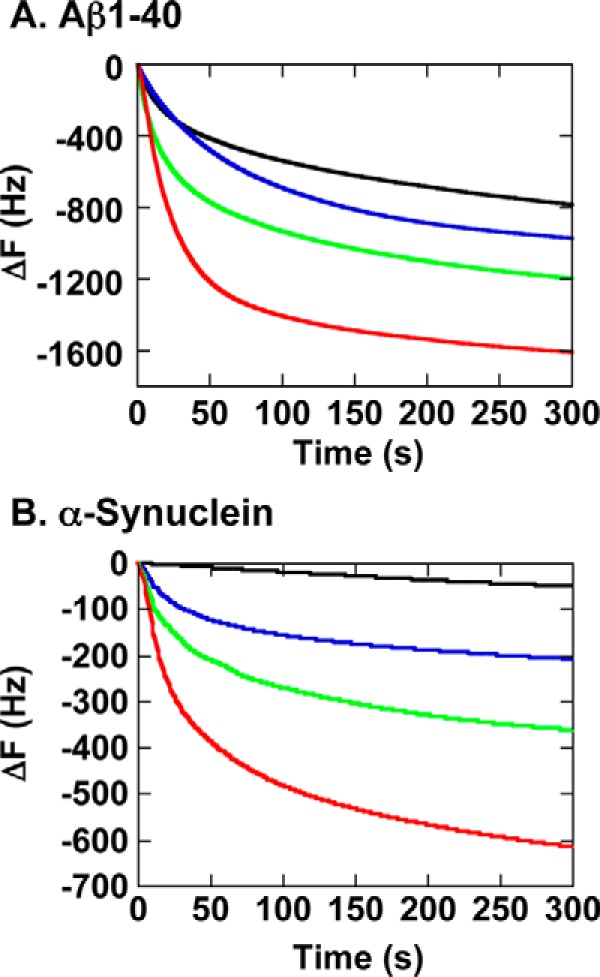
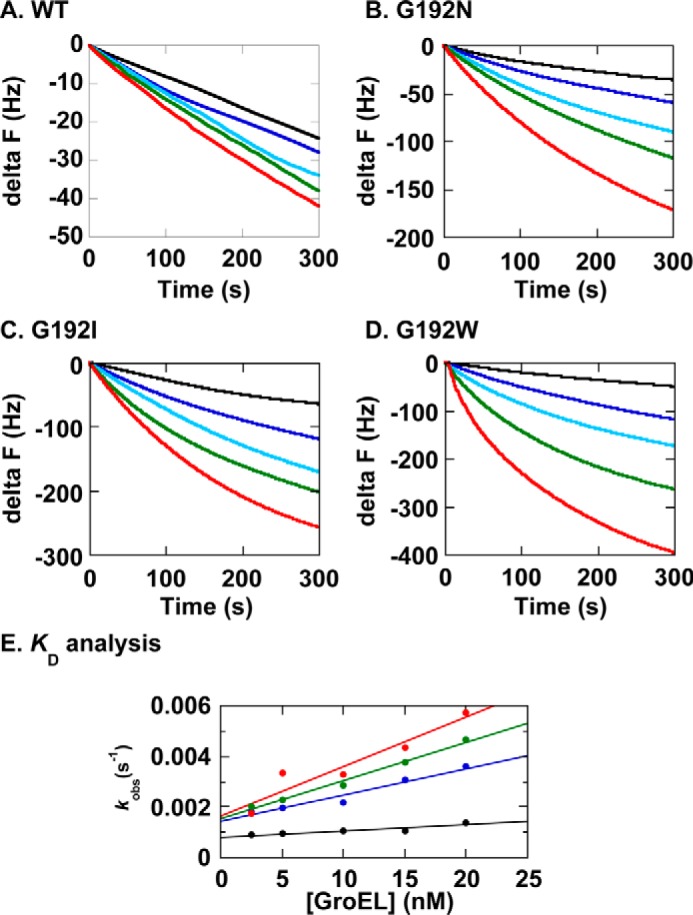
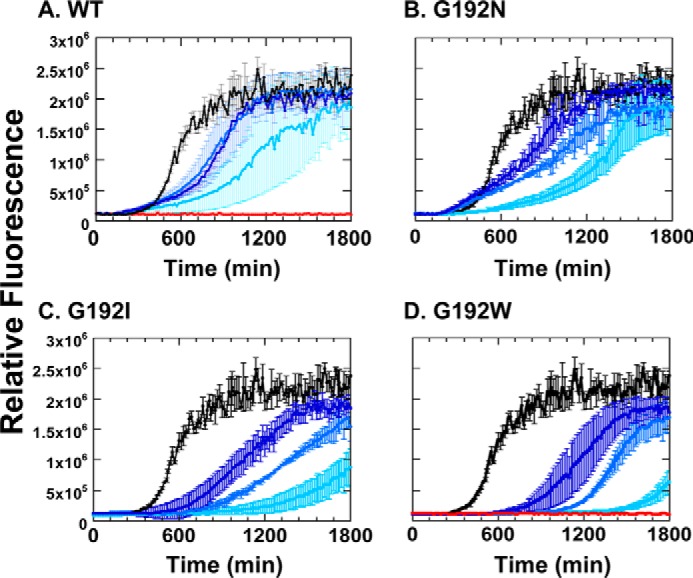
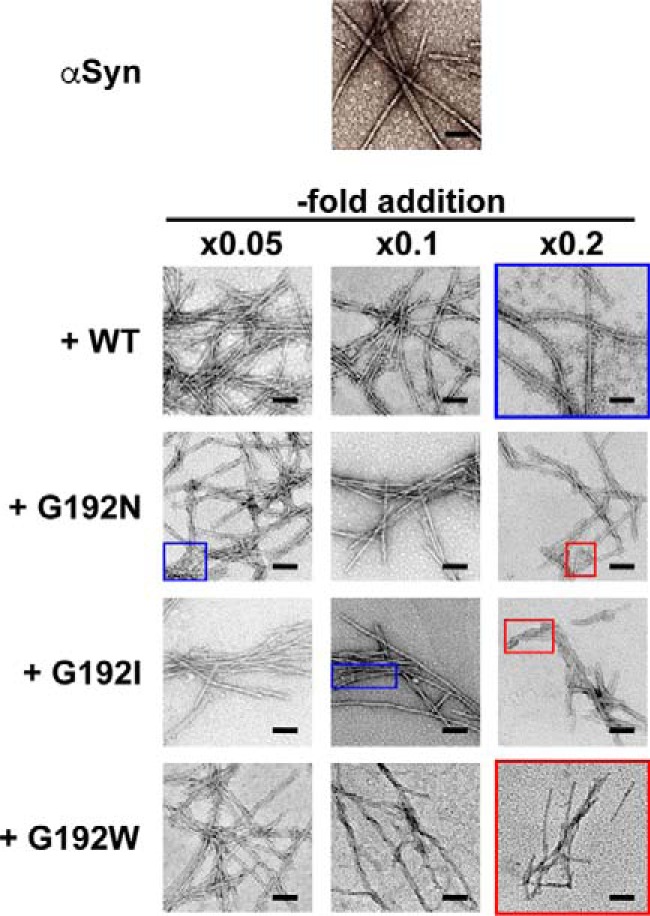
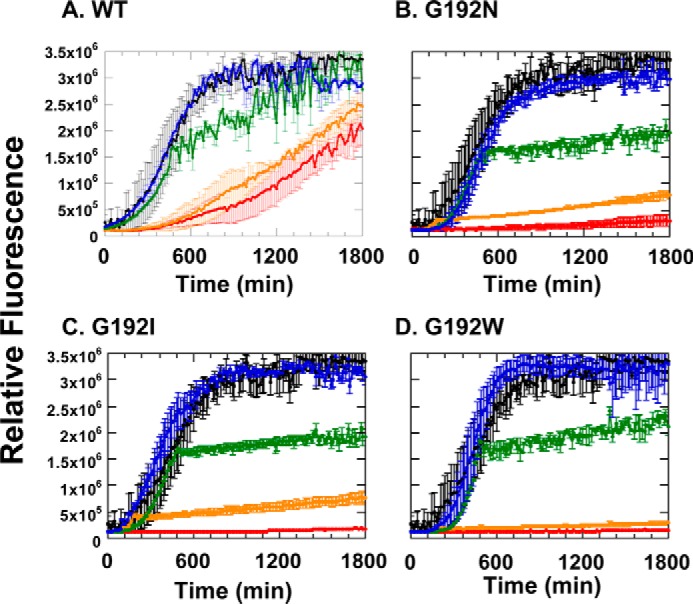
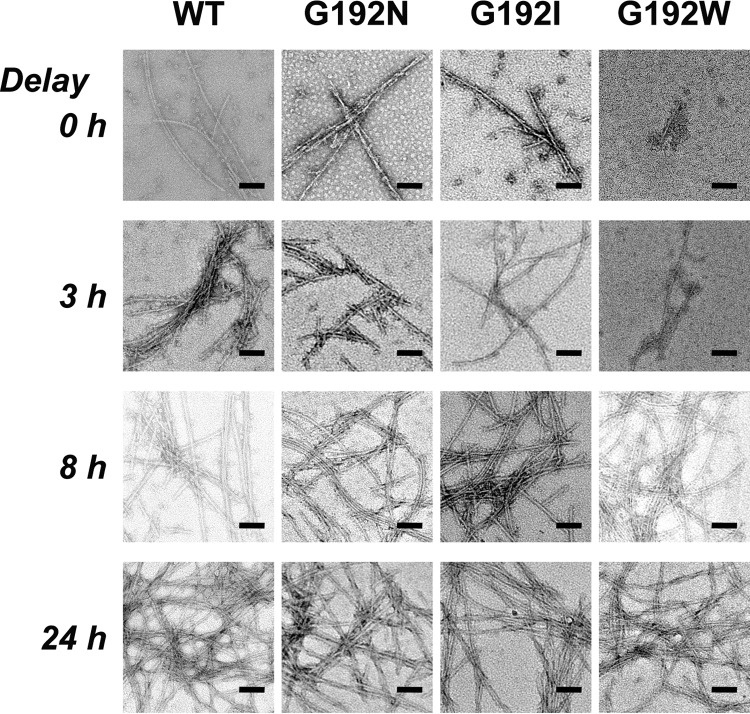
The isolated apical domain of the Escherichia coli GroEL subunit displays the ability to suppress the irreversible fibrillation of numerous amyloid-forming polypeptides. In previous experiments, we have shown that mutating Gly-192 (located at hinge II that connects the apical domain and the intermediate domain) to a tryptophan results in an inactive chaperonin whose apical domain is disoriented. In this study, we have utilized this disruptive effect of Gly-192 mutation to our advantage, by substituting this residue with amino acid residues of varying van der Waals volumes with the intent to modulate the affinity of GroEL toward fibrillogenic peptides. The affinities of GroEL toward fibrillogenic polypeptides such as Aβ(1-40) (amyloid-β(1-40)) peptide and α-synuclein increased in accordance to the larger van der Waals volume of the substituent amino acid side chain in the G192X mutants. When we compared the effects of wild-type GroEL and selected GroEL G192X mutants on α-synuclein fibril formation, we found that the effects of the chaperonin on α-synuclein fibrillation were different; the wild-type chaperonin caused changes in both the initial lag phase and the rate of fibril extension, whereas the effects of the G192X mutants were more specific toward the nucleus-forming lag phase. The chaperonins also displayed differential effects on α-synuclein fibril morphology, suggesting that through mutation of Gly-192, we may induce changes to the intermolecular affinities between GroEL and α-synuclein, leading to more efficient fibril suppression, and in specific cases, modulation of fibril morphology.

Keywords: GroEL; alpha-synuclein (a-synuclein); amyloid fibrils; chaperonin; protein aggregation; protein engineering; protein misfolding; protein-protein interaction.


Figures

FIGURE 1.
FIGURE 1.
Structural model of GroE, showing the location of Gly-192 in the GroEL subunit. The figure on the left is a cutaway image of the GroEL14·ADP7·GroES7 complex, derived from Protein Data Bank (PDB) file 1AON (36). Selected GroEL and GroES subunits have been removed to showcase the characteristic central cavity of GroEL14. The GroEL subunits shown in the forefront of the figure have been colored to highlight the domain architecture; the apical domain is in red, the intermediate domain is in green, and the equatorial domain is in blue. The panel on the right is an expanded view of the hinge II region of the GroEL subunit, with Gly-192 represented as space-filling forms. Images were drawn using UCSF Chimera (37).
FIGURE 2.
FIGURE 2.
Structural characterization of the seven GroEL G192X mutants. A, far-UV CD spectra of GroEL mutants. The color legend next to panel A denotes the data corresponding to each mutant, and this legend is valid, when applicable, for the data in each panel shown in Figs. 2–4. B, ANS fluorescence spectra of GroEL mutants to gauge surface hydrophobicity. The inset in B is a plot of the fluorescence intensity at 478 nm (F478) for each trace against the van der Waals volume of the amino acid side chains that replace Gly-192 in each mutant.
FIGURE 3.
FIGURE 3.
Functional characterization of the seven GroEL G192X mutants. A, ATPase activities of the GroEL G192X mutants in the absence of GroES. B, ATPase activities of the GroEL G192X mutants in the presence of GroES. C, refolding assays of porcine MDH. D, refolding assays of bovine rhodanese. The gray traces in panels C and D denote spontaneous refolding reactions of each substrate protein performed in the absence of chaperonin. Refolding reactions in panels C and D were initiated in the absence of ATP, and 2 mm ATP was subsequently added at t = 5 min. E, functional characterizations of the G192X mutants summarized by plotting four distinct experimental values: the released inorganic phosphate concentrations detected at t = 60 min in panel A (closed circles: solid lines), similar values for panel B (open circles: dashed lines), and the net refolding yields at t = 60 min shown in panels C (closed squares) and D (closed diamonds), in a manner analogous to that shown in the inset to Fig. 2B. Error bars represent the S.E. of each data point.
FIGURE 4.
FIGURE 4.
QCM binding analyses of GroEL G192X mutants to immobilized GroES ESC7. Preparations of ESC7 were immobilized to the sensor chip using standard methods, and aliquots of GroEL G192X were added to the cell. Signal changes reflect changes to the mass that is bound to the sensor chip, which in this case represents the amount of GroEL G192X that is bound to ESC7. With the exception of GroEL WT, all measurements were performed in the absence of ATP.
FIGURE 5.
FIGURE 5.
QCM binding analyses of GroEL WT and three G192X mutants to immobilized fibrillogenic polypeptides. A, the binding of GroEL to immobilized Aβ(1–40) peptide. B, the binding of GroEL to immobilized αSyn-His6. In each panel, the black trace indicates the binding of GroEL WT, the blue trace indicates the binding of GroEL G192N, the green trace indicates the binding of GroEL G192I, and the red trace indicates the binding of GroEL G192W.
FIGURE 6.
FIGURE 6.
Quantitative QCM binding analyses of GroEL WT and three G192X mutants to immobilized αSyn-His6. A–D, titrations of αSyn-His6 immobilized to the QCM sensor with increasing concentrations of GroEL WT (A), GroEL G192N (B), G192I (C), or G192W (D). Colors in each panel indicate QCM traces obtained by adding GroEL at the following concentrations: black, 2.5 nm; blue, 5 nm; cyan, 10 nm; green, 15 nm; red, 20 nm. E, estimation of KD values through linear regression fitting of [GroEL] versus kobs plots. Black, WT; blue, G192N; green, G192I; red, G192W.
FIGURE 7.
FIGURE 7.
Th-T fluorescence assays of αSyn fibrillation in the presence of GroEL WT and G192X mutants. A, GroEL WT. B, GroEL G192N. C, GroEL G192I. D, GroEL G192W. In each panel, lighter shades of blue are used to denote increasing concentrations of GroEL added to the experiment. Specific molar ratios of GroEL14 added to each sample relative to αSyn monomer are as follows: 0.05:1, 0.1:1, 0.2:1 (from dark blue to light blue). Red traces in panels A and D indicate Th-T fluorescence changes of GroEL WT and G192W incubated under identical conditions, respectively. Error bars represent the S.E. of each data point.
FIGURE 8.
FIGURE 8.
Transmission electron micrographs of αSyn fibrils formed in Fig. 7 (at t = 30 h). Scale bars in each panel indicate 100 nm. The uppermost panel shows negatively stained samples of typical αSyn fibrils formed in the absence of chaperonin. The lower panels are grouped horizontally according to the type of chaperonin added to the αSyn fibril-forming reaction, and vertically according to the specific ratio of chaperonin oligomer added relative to αSyn monomer. Blue and red borders indicate grouping of panels and regions that show a common fibril morphology, as discussed in detail under “Results.”
FIGURE 9.
FIGURE 9.
Delayed addition of GroEL WT and G192X mutants to fibrillation reactions of αSyn. A–D, after initiating the fibril-forming reaction in the absence of chaperonin, either GroEL WT (A) or GroEL G192N (B), G192I (C), or G192W (D) mutant was added after a fixed delay time. The ratio of GroEL14 to αSyn added was fixed at 0.2:1. The specific time of delay before the addition of chaperonin to the experiment follows the following convention: red, chaperonin added at zero time (no delay); orange, chaperonin added after a 3-h (180-min) delay; green, chaperonin added after an 8-h (480-min) delay; blue, chaperonin added after a 24-h (1440-min) delay. Black traces indicate reactions in the absence of chaperonin. Error bars represent the S.E. of each data point.
FIGURE 10.
FIGURE 10.
TEM images of αSyn fibril samples that were recovered after the experiments shown in Fig. 9. Images are grouped vertically according to the type of GroEL added. The top row indicates αSyn fibrils that formed in the presence of GroEL without delay time (0 h), and subsequent lower rows show samples from reactions that were initiated in buffer, with GroEL added at progressively later intervals (3, 8, and 24 h). Scale bars indicate 100 nm.

References

    1. Hayer-Hartl M., Bracher A., and Hartl F. U. (2016) The GroEL-GroES chaperonin machine: a nano-cage for protein folding. Trends Biochem. Sci. 41, 62–76 - PubMed
    1. Saibil H. R., Fenton W. A., Clare D. K., and Horwich A. L. (2013) Structure and allostery of the chaperonin GroEL. J. Mol. Biol. 425, 1476–1487 - PubMed
    1. Sharma S., Chakraborty K., Müller B. K., Astola N., Tang Y. C., Lamb D. C., Hayer-Hartl M., and Hartl F. U. (2008) Monitoring protein conformation along the pathway of chaperonin-assisted folding. Cell 133, 142–153 - PubMed
    1. Lin Z., Madan D., and Rye H. S. (2008) GroEL stimulates protein folding through forced unfolding. Nat. Struct. Mol. Biol. 15, 303–311 - PMC - PubMed
    1. Chaudhuri T. K., Verma V. K., and Maheshwari A. (2009) GroEL assisted folding of large polypeptide substrates in Escherichia coli: present scenario and assignments for the future. Prog. Biophys. Mol. Biol. 99, 42–50 - PubMed

MeSH terms

Associated data