Review
. 2016 Dec;20(12):916-930.
doi: 10.1016/j.tics.2016.09.007. Epub 2016 Oct 12.

Oscillatory Dynamics of Prefrontal Cognitive Control

Affiliations
Review

Oscillatory Dynamics of Prefrontal Cognitive Control

Randolph F Helfrich et al. Trends Cogn Sci. 2016 Dec.

Abstract

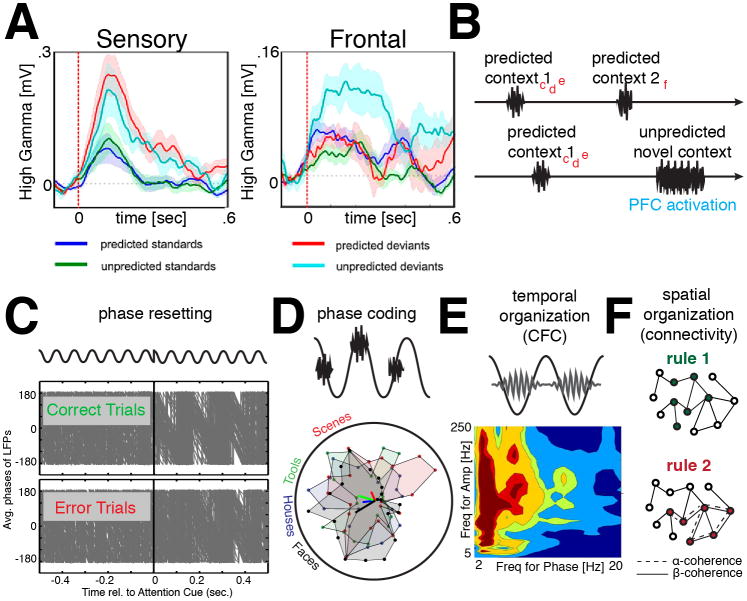
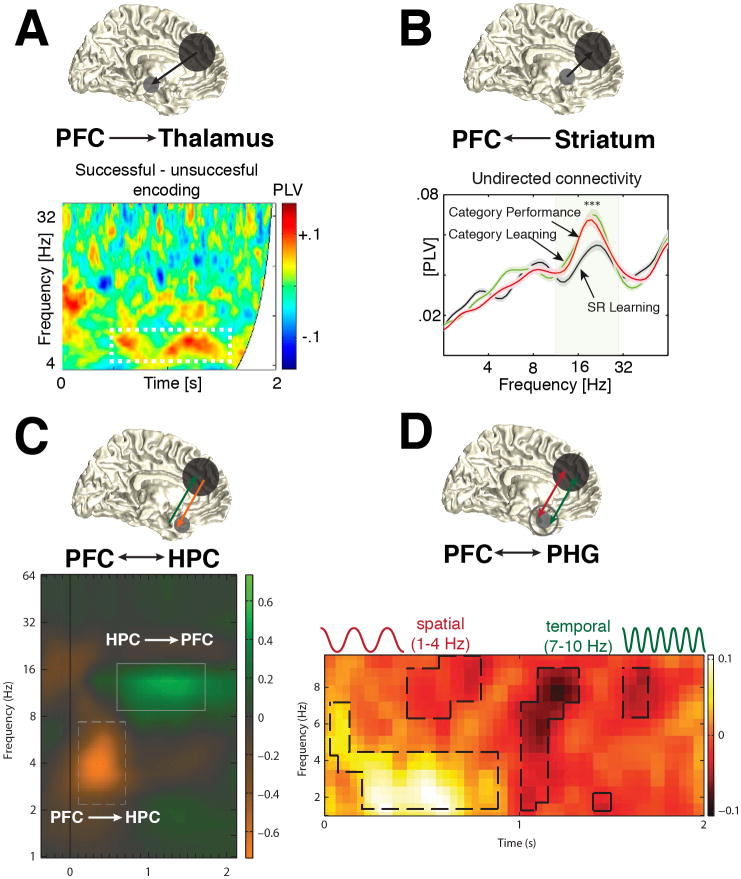
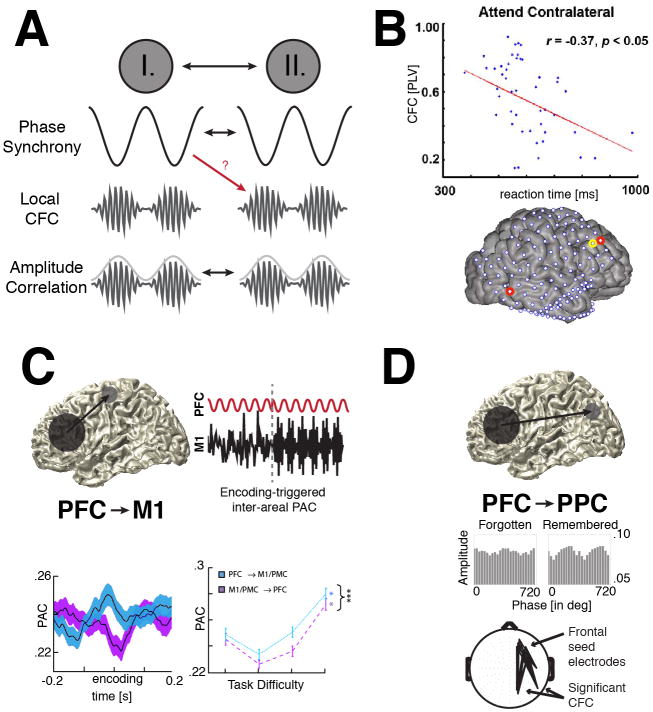
The prefrontal cortex (PFC) provides the structural basis for numerous higher cognitive functions. However, it is still largely unknown which mechanisms provide the functional basis for flexible cognitive control of goal-directed behavior. Here, we review recent findings that suggest that the functional architecture of cognition is profoundly rhythmic and propose that the PFC serves as a conductor to orchestrate task-relevant large-scale networks. We highlight several studies that demonstrated that oscillatory dynamics, such as phase resetting, cross-frequency coupling (CFC), and entrainment, support PFC-dependent recruitment of task-relevant regions into coherent functional networks. Importantly, these findings support the notion that distinct spectral signatures reflect different cortical computations supporting effective multiplexing on different temporal channels along the same anatomical pathways.

Keywords: cross-frequency coupling; large-scale networks; network connectivity; neuronal entrainment; neuronal oscillations; prefrontal cortex.


Figures

Figure 1
Figure 1. Oscillatory mechanisms supporting cognitive processing in frontal cortex
(A) High gamma responses to standard and deviants in sensory and frontal regions. Note, that only unpredicted deviants evoke a strong response in PFC, raising the questions of how predictions are implemented in frontal areas. (B) Illustration of two predicted contexts, where a brief burst of activity might be coordinated by the underlying oscillatory dynamics. Different contexts could be embedded in distinct spatiotemporal configurations (red letters indicate examples in Figure 1C-F) of the same network. Hence, the PFC only becomes active if a novel context is presented. (C) Phase resetting at the beginning of the trial is stronger for correct shifts in attention. The grey lines indicate the low frequency phase of single trials. Note the increased phase consistency for correct trials (upper panel). (D) Activity at different time points during the oscillatory cycle encodes distinct categories. Houses (blue), scenes (red), tools (green) and faces (black) were encoded at different phases and frequencies of the underlying low-frequency oscillation. (E) Cross-frequency coupling could mediate cortical computations and information integration across several temporal scales. The example data shows that the phase of delta/theta activity (2-5 Hz) modulates the amplitude in a broad range of frequencies (10–250 Hz). (F) Frequency-specific connectivity patterns encode distinct task relevant rules. The schematic depicts how the same neuronal assembly might have been differentially connected to encode two different rules (rule 1: color vs. rule 2: orientation, [41]). Furthermore, different frequency bands allow multiplexing different computations on several temporal scales. The graphs in a and c are reproduced with permission from [31,33]. The graphs in d and e appeared under the Creative Commons Attribution (CC BY) license [28,38].
Figure 2
Figure 2. Prefrontal cortex dependent large-scale networks
(A) PFC-Thalamus: Increased phase-locking between frontal EEG sensors and the right anterior thalamic nucleus (RATN) for successfully encoded items. (B) PFC-Striatum: Undirected connectivity for category learning/performance and stimulus-response (SR) learning. Note the significant peak in the beta-band (around 20 Hz) for category over SR learning. Directional connectivity analyses between the PFC and striatum revealed that beta interactions signaled mainly the information flow from striatum to the PFC and not vice versa. (C) PFC-Hippocampus: Differences in inter-areal connectivity. While changes in the alpha-band reflected directional interactions from Hippocampus to the PFC, theta-band activity supported information flow in the opposite direction. (D) PFC-Parahippocampal gyrus: Network synchronization the delta (1-4 Hz) and theta/alpha-bands (7-10 Hz) multiplexed correct retrieval for spatial (delta) or temporal (theta/alpha) contexts. The graph in a appeared under the Creative Commons Attribution (CC BY) license [49]. The graphs in b-d are reproduced with permission from [–56].
Figure 3
Figure 3. Multiplexed cognition: Entrainment and the spatiotemporal organization of goal-directed behavior
(A) Schematic illustration of how different connectivity metrics might be related. Two hypothetical populations (I and II) could be phase synchronous and exhibit local cross-frequency coupling. Hence, also the amplitudes of the high frequency activity should be correlated over time, which might be reflected in inter-areal PAC (red arrow). However, it is currently unclear whether these phenomena always interact or whether they could occur in isolation. (B) Local CFC: The strength of PAC in frontal and parietal regions correlated with reaction times if attention was deployed to the contralateral hemifield. Circled electrodes show significant effects, the yellow-circled electrode indicates the example electrode. (C) Upper: Directional PAC between the frontal theta-phase and high-gamma in M1. Lower: Directionality was most pronounced at encoding onset and scaled with task-demand. (D) Upper: Directional PAC from PFC to posterior parietal cortex. Lower: Inter-areal theta-gamma PAC was stronger for remembered than forgotten items between frontal seed regions and parieto-occipital EEG sensors. The graph in b appeared under the Creative Commons Attribution (CC BY) license [28]. The graphs in c-d are reproduced with permission from [82,83].
Figure 4
Figure 4. Linking structural and functional connectivity
(A) Left: Visualization of the superior longitudinal fasciculi (SLF1-3). Right: Asymmetries in white matter volume correlated with the individual ability to lateralize alpha and gamma power in a spatial attention task. (B) Theta-burst TMS to the left FEF, the vertex and the right FEF. The transient TMS induced deactivation of left or right FEF resulted in decreased attentional alpha modulation in the contralateral visual field as compared to the ipsilateral hemifield. (C) Lesions to the prefrontal cortex (grey circle over the left PFC) lead to alpha asymmetries of parieto-occipital EEG sensors with higher alpha power at ipsilateral sensors. (D) Upper: If the lesion hemisphere is challenged (e.g. in a 3 item WM task, upper right) then a compensatory increase in theta power is observed over the non-lesioned PFC, which correlates with electrophysiological signatures over contralateral visual areas. Lower: This effect was restricted to patients with lateralized prefrontal lesions and was not observed in age-matched healthy control group, independent of WM load (1 or 3 items). The graph in a appeared under the Creative Commons Attribution (CC BY) license [86]. The graphs in b-d are reproduced with permission from [87,100,101].
Figure I
Figure I. From linear to non-linear analysis techniques
(a) Time-frequency analysis of evoked phaselocked (black box) and non-phaselocked (white boxes) activity. (b) Rotation of the power spectrum (black) around a frequency point at approximately 40 Hz might be mistaken as spectral changes in multiple frequency bands (red). Electrophysiological recordings exhibit a prominent 1/f slope (dashed line), which might obscure true oscillatory activity, which is visible as a bump (α/β). (c) The effects of band-pass filtering on non-sinusoidal oscillations: The sensorimotor mu rhythm is rendered sinusoidal by narrow-banded filtering. (d) Exemplary non-linear inverted u-shaped relationship between connectivity and behavior. The graph in a appeared under the Creative Commons Attribution (CC BY) license [28].
Figure II
Figure II. Directional connectivity analyses
(a) Directionality can be assessed by analyzing onset or peak latencies in different nodes of a network. (b) Oscillatory signals, which are circular in nature, lack a defined beginning and end. Hence, several methods such as cross-correlation, granger causality of the phase slope index have been introduced to infer directionality.

References

    1. Szczepanski SM, Knight RT. Insights into human behavior from lesions to the prefrontal cortex. Neuron. 2014;83:1002–1018. - PMC - PubMed
    1. Miller EK, Cohen JD. An integrative theory of prefrontal cortex function. Annu Rev Neurosci. 2001;24:167–202. - PubMed
    1. Siegel M, et al. Spectral fingerprints of large-scale neuronal interactions. Nat Rev Neurosci. 2012;13:121–134. - PubMed
    1. Fries P. Rhythms for Cognition: Communication through Coherence. Neuron. 2015;88:220–235. - PMC - PubMed
    1. Thut G, et al. The functional importance of rhythmic activity in the brain. Curr Biol CB. 2012;22:R658–663. - PubMed