

Estimating infectious disease transmission distances using the overall distribution of cases
- PMID: 27744095
- PMCID: PMC5159225
- DOI: 10.1016/j.epidem.2016.10.001
Estimating infectious disease transmission distances using the overall distribution of cases
Abstract
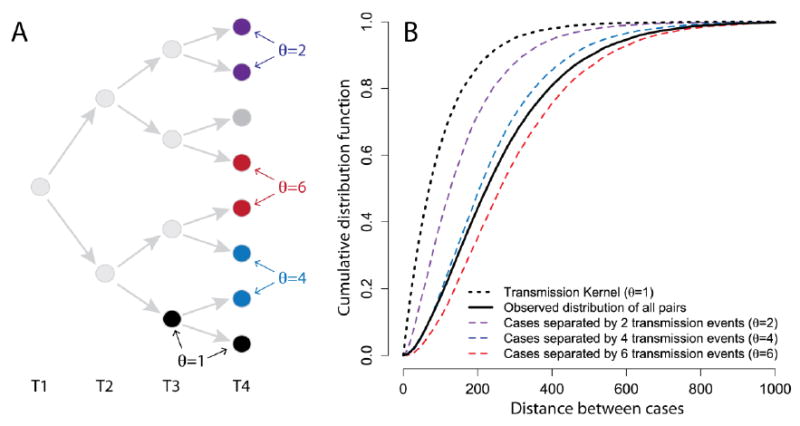
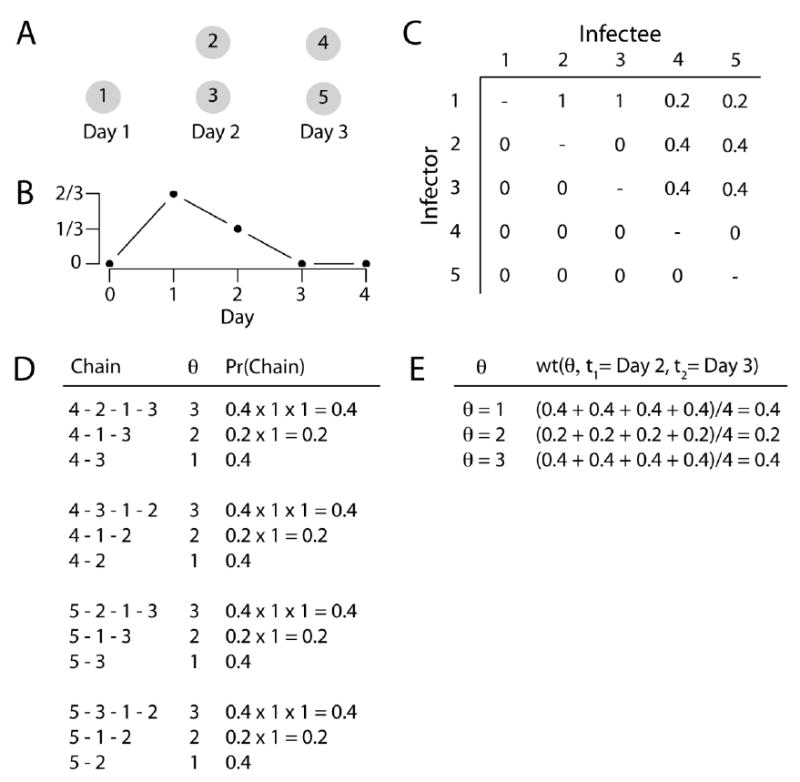
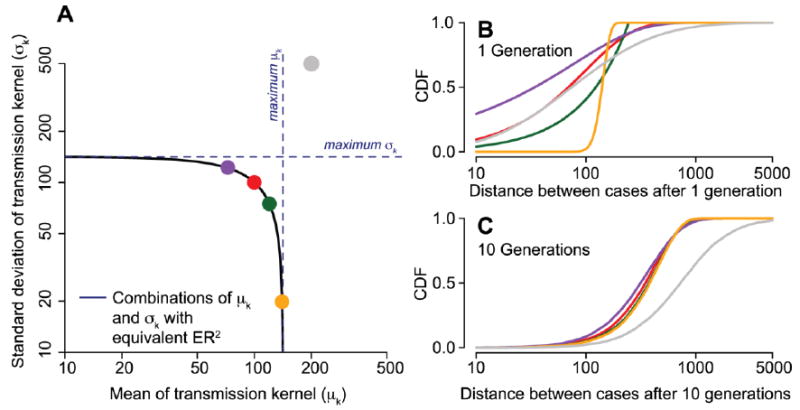
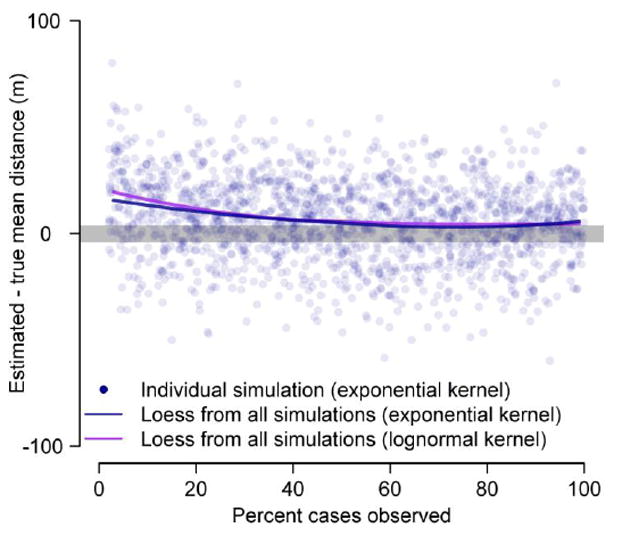
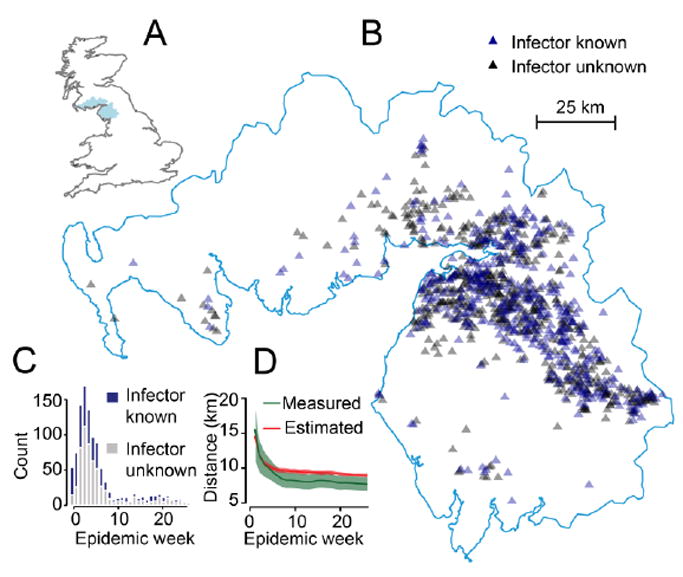
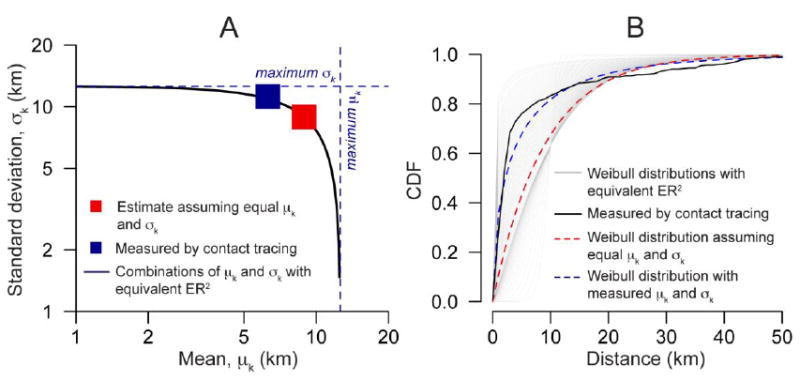
The average spatial distance between transmission-linked cases is a fundamental property of infectious disease dispersal. However, the distance between a case and their infector is rarely measurable. Contact-tracing investigations are resource intensive or even impossible, particularly when only a subset of cases are detected. Here, we developed an approach that uses onset dates, the generation time distribution and location information to estimate the mean transmission distance. We tested our method using outbreak simulations. We then applied it to the 2001 foot-and-mouth outbreak in Cumbria, UK, and compared our results to contact-tracing activities. In simulations with a true mean distance of 106m, the average mean distance estimated was 109m when cases were fully observed (95% range of 71-142). Estimates remained consistent with the true mean distance when only five percent of cases were observed, (average estimate of 128m, 95% range 87-165). Estimates were robust to spatial heterogeneity in the underlying population. We estimated that both the mean and the standard deviation of the transmission distance during the 2001 foot-and-mouth outbreak was 8.9km (95% CI: 8.4km-9.7km). Contact-tracing activities found similar values of 6.3km (5.2km-7.4km) and 11.2km (9.5km-12.8km), respectively. We were also able to capture the drop in mean transmission distance over the course of the outbreak. Our approach is applicable across diseases, robust to under-reporting and can inform interventions and surveillance.
Keywords: Epidemiology; Foot-and-mouth disease; Infectious disease; Outbreaks; Transmission distance.
Copyright © 2016 The Author(s). Published by Elsevier B.V. All rights reserved.
Conflict of interest statement
The authors declare no competing interests.
Figures
References
-
- Assiri A, McGeer A, Perl TM, Price CS, Rabeeah, Al AA, Cummings DAT, Alabdullatif ZN, Assad M, Almulhim A, Makhdoom H, Madani H, Alhakeem R, Al-Tawfiq JA, Cotten M, Watson SJ, Kellam P, Zumla AI, Memish ZA KSA MERS-CoV Investigation Team. Hospital outbreak of Middle East respiratory syndrome coronavirus. N Engl J Med. 2013;369:407–416. doi: 10.1056/NEJMoa1306742. - DOI - PMC - PubMed
-
- Bhoomiboonchoo P, Gibbons RV, Huang A, Yoon I-K, Buddhari D, Nisalak A, Chansatiporn N, Thipayamongkolgul M, Kalanarooj S, Endy T, Rothman AL, Srikiatkhachorn A, Green S, Mammen MP, Cummings DA, Salje H. The spatial dynamics of dengue virus in Kamphaeng Phet, Thailand. PLoS Negl Trop Dis. 2014;8:e3138. doi: 10.1371/journal.pntd.0003138. - DOI - PMC - PubMed
-
- Bovet P, Benhamou S. Spatial analysis of animals’ movements using a correlated random walk model. Journal of Theoretical Biology. 1988;131:419–433. doi: 10.1016/S0022-5193(88)80038-9. - DOI
-
- Cleveland WS, Grosse E, Shyu WM. Local regression models. Statistical models in S 1992
MeSH terms
Grants and funding
LinkOut - more resources
Full Text Sources
Other Literature Sources
