Review
. 2016 Dec:41:150-158.
doi: 10.1016/j.gde.2016.09.006. Epub 2016 Oct 13.

The impact of recent population history on the deleterious mutation load in humans and close evolutionary relatives

Affiliations
Review

The impact of recent population history on the deleterious mutation load in humans and close evolutionary relatives

Yuval B Simons et al. Curr Opin Genet Dev. 2016 Dec.

Abstract

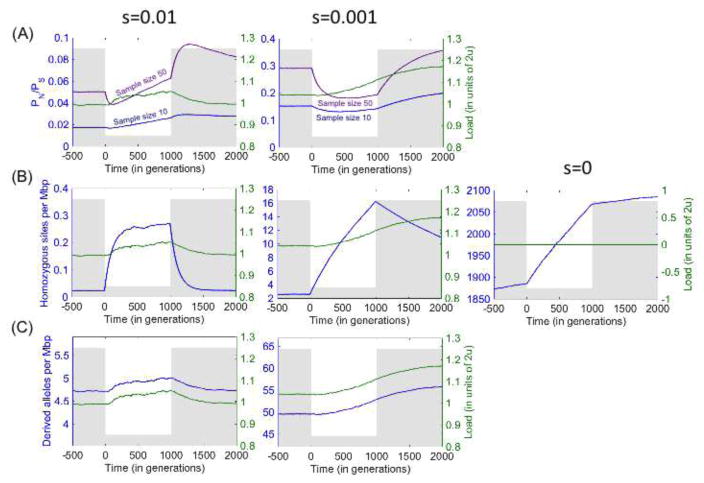
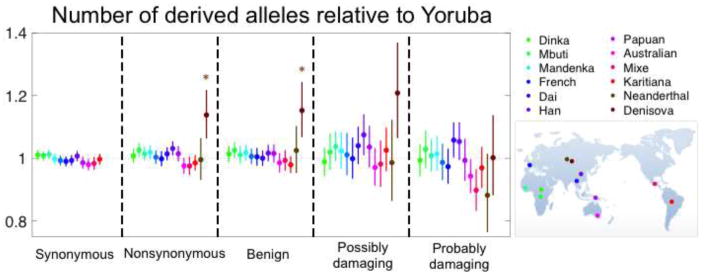
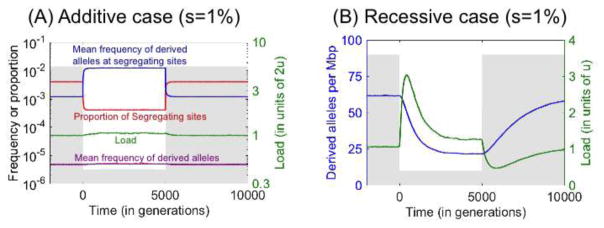
Over the past decade, there has been both great interest and confusion about whether recent demographic events-notably the Out-of-Africa-bottleneck and recent population growth-have led to differences in mutation load among human populations. The confusion can be traced to the use of different summary statistics to measure load, which lead to apparently conflicting results. We argue, however, that when statistics more directly related to load are used, the results of different studies and data sets consistently reveal little or no difference in the load of non-synonymous mutations among human populations. Theory helps to understand why no such differences are seen, as well as to predict in what settings they are to be expected. In particular, as predicted by modeling, there is evidence for changes in the load of recessive loss of function mutations in founder and inbred human populations. Also as predicted, eastern subspecies of gorilla, Neanderthals and Denisovans, who are thought to have undergone reductions in population sizes that exceed the human Out-of-Africa bottleneck in duration and severity, show evidence for increased load of non-synonymous mutations (relative to western subspecies of gorillas and modern humans, respectively). A coherent picture is thus starting to emerge about the effects of demographic history on the mutation load in populations of humans and close evolutionary relatives.


Figures

Figure 1
Figure 1
Load and summaries used to measure load under simulations with a bottleneck and additive selection. The population size (grey) drops from 10,000 to 1,000 at time 0 and recovers a 1,000 generations later. The number of sites simulated in each case was chosen to achieve standard errors below 1%. For further simulation details see [31].
Figure 2
Figure 2
The genealogy at a locus of one sample from each of two populations, illustrating that the expected number of derived neutral alleles on each sample is the same, and depends only on the time to the most recent common ancestor (TMRCA) of the two lineages and not on the demographic history of the populations.
Figure 3
Figure 3
No significant difference between human populations in the mean number of derived alleles per individual. Each population sample was compared with the Yoruba sample, using data from [32]. Nonsynonymous SNPs were classified into benign, possibly and probably damaging using PolyPhen 2.0 as described in [32]. The numbers of derived alleles for each comparison were counted at sites that were segregating in the joint sample from the two populations, and significance and the shown 95% confidence intervals were evaluated as described in Box 1, dividing the genome into 1,000 blocks. While there are multiple tests performed, it is not obvious how to correct for them, because population samples are also not independent. However, if we assume that at minimum 6 tests were performed then none of the comparisons among human populations is significant at the 5% level. The comparisons with Neanderthal and Denisova incorporate the modifications described in [32], where Denisova are significantly different regardless of the correction for multiple testing.
Figure 4
Figure 4
Bottleneck effects on load and the number of derived alleles in additive (A) and recessive (B) cases. The population size (grey) drops from 10,000 to 1,000 at time 0 and recovers 5,000 generations later. The number of sites simulated in each case was chosen to achieve standard errors below 1%. For further simulation details see [31].

References

    1. Wall JD, Przeworski M. When did the human population size start increasing? Genetics. 2000;155:1865–1874. - PMC - PubMed
    1. Voight BF, Adams AM, Frisse LA, Qian Y, Hudson RR, Di Rienzo A. Interrogating multiple aspects of variation in a full resequencing data set to infer human population size changes. Proc Natl Acad Sci U S A. 2005;102:18508–18513. - PMC - PubMed
    1. Keinan A, Mullikin JC, Patterson N, Reich D. Measurement of the human allele frequency spectrum demonstrates greater genetic drift in East Asians than in Europeans. Nat Genet. 2007;39:1251–1255. - PMC - PubMed
    1. Tennessen JA, Bigham AW, O’Connor TD, Fu W, Kenny EE, Gravel S, McGee S, Do R, Liu X, Jun G, et al. Evolution and functional impact of rare coding variation from deep sequencing of human exomes. Science. 2012;337:64–69. - PMC - PubMed
    1. Coventry A, Bull-Otterson LM, Liu X, Clark AG, Maxwell TJ, Crosby J, Hixson JE, Rea TJ, Muzny DM, Lewis LR, et al. Deep resequencing reveals excess rare recent variants consistent with explosive population growth. Nat Commun. 2010;1:131. - PMC - PubMed