

Recent Historical Migrations Have Shaped the Gene Pool of Arabs and Berbers in North Africa
- PMID: 27744413
- PMCID: PMC5644363
- DOI: 10.1093/molbev/msw218
Recent Historical Migrations Have Shaped the Gene Pool of Arabs and Berbers in North Africa
Abstract
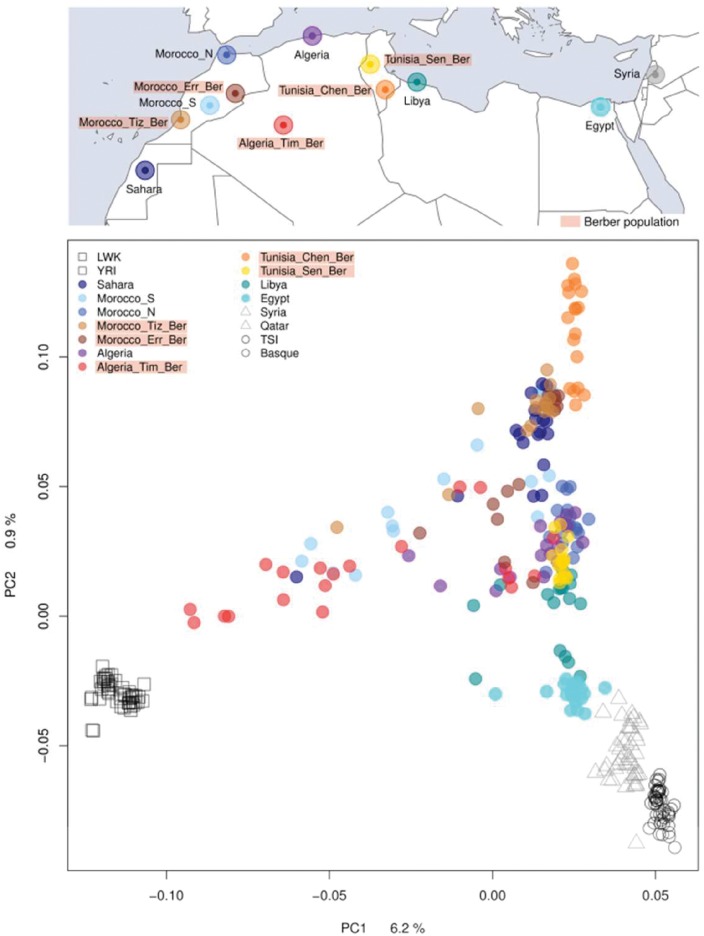
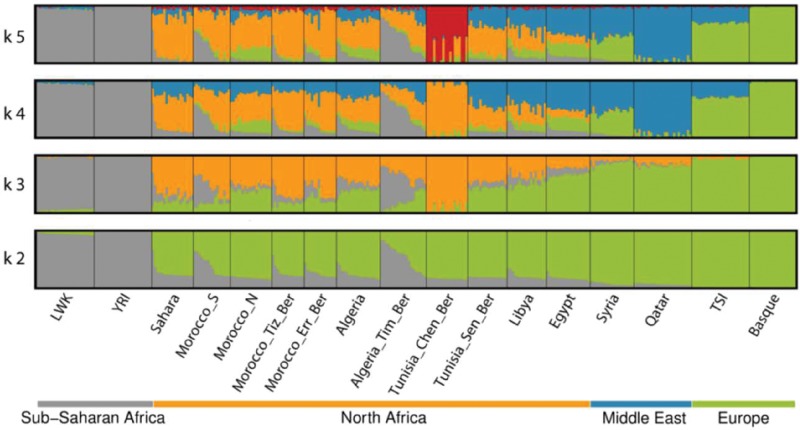
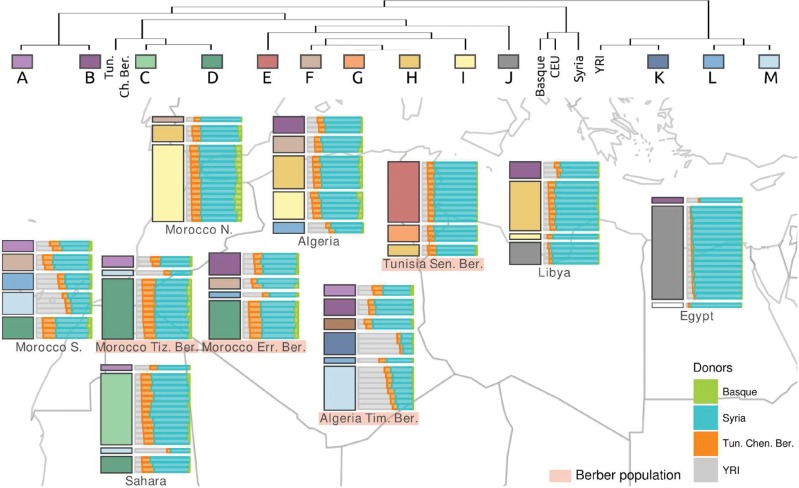
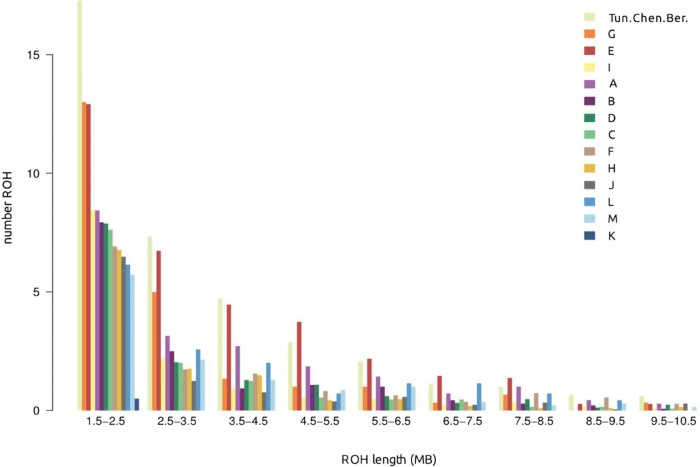
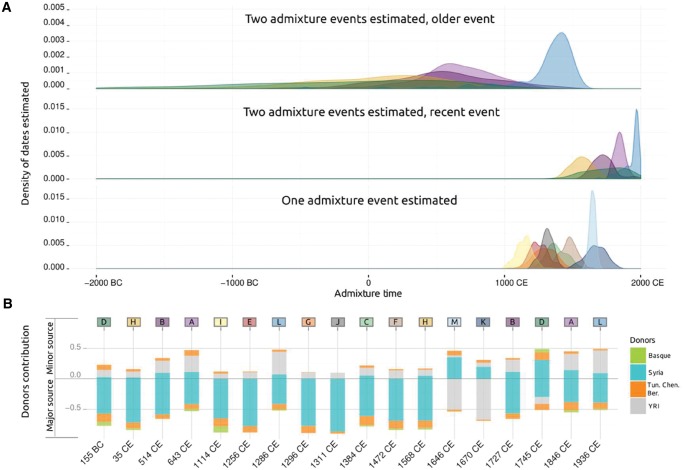
North Africa is characterized by its diverse cultural and linguistic groups and its genetic heterogeneity. Genomic data has shown an amalgam of components mixed since pre-Holocean times. Though no differences have been found in uniparental and classical markers between Berbers and Arabs, the two main ethnic groups in the region, the scanty genomic data available have highlighted the singularity of Berbers. We characterize the genetic heterogeneity of North African groups, focusing on the putative differences of Berbers and Arabs, and estimate migration dates. We analyze genome-wide autosomal data in five Berber and six Arab groups, and compare them to Middle Easterns, sub-Saharans, and Europeans. Haplotype-based methods show a lack of correlation between geographical and genetic populations, and a high degree of genetic heterogeneity, without strong differences between Berbers and Arabs. Berbers enclose genetically diverse groups, from isolated endogamous groups with high autochthonous component frequencies, large homozygosity runs and low effective population sizes, to admixed groups with high frequencies of sub-Saharan and Middle Eastern components. Admixture time estimates show a complex pattern of recent historical migrations, with a peak around the 7th century C.E. coincident with the Arabization of the region; sub-Saharan migrations since the 1st century B.C. in agreement with Roman slave trade; and a strong migration in the 17th century C.E., coincident with a huge impact of the trans-Atlantic and trans-Saharan trade of sub-Saharan slaves in the Modern Era. The genetic complexity found should be taken into account when selecting reference groups in population genetics and biomedical studies.
Keywords: Berbers; North Africa; admixture; genome wide SNPs; haplotype; population genetics.
© The Author 2016. Published by Oxford University Press on behalf of the Society for Molecular Biology and Evolution.
Figures
References
-
- Barton RNE, Bouzouggar A, Hogue JT, Lee S, Collcutt SN, Ditchfield P. 2013. Origins of the iberomaurusian in NW Africa: new AMS radiocarbon dating of the middle and later stone age deposits at taforalt cave, Morocco. J Hum Evol. 65:266–281. - PubMed
MeSH terms
Substances
LinkOut - more resources
Full Text Sources
Other Literature Sources
