. 2016 Sep;49(5):329-341.
doi: 10.3961/jpmph.16.038. Epub 2016 Sep 8.

Short-term Effects of Ambient Air Pollution on Emergency Department Visits for Asthma: An Assessment of Effect Modification by Prior Allergic Disease History

Affiliations

Short-term Effects of Ambient Air Pollution on Emergency Department Visits for Asthma: An Assessment of Effect Modification by Prior Allergic Disease History

Juhwan Noh et al. J Prev Med Public Health. 2016 Sep.

Abstract

Objectives: The goal of this study was to investigate the short-term effect of ambient air pollution on emergency department (ED) visits in Seoul for asthma according to patients' prior history of allergic diseases.

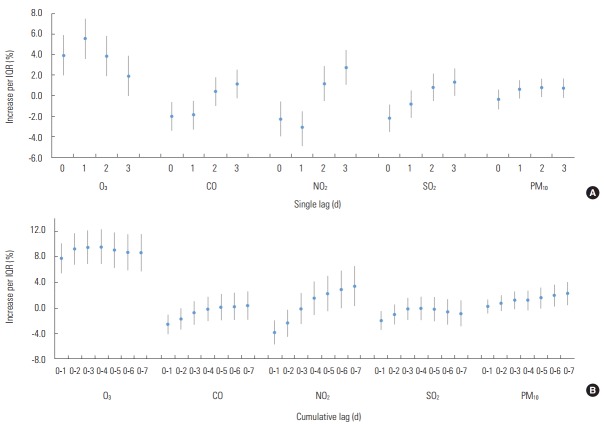
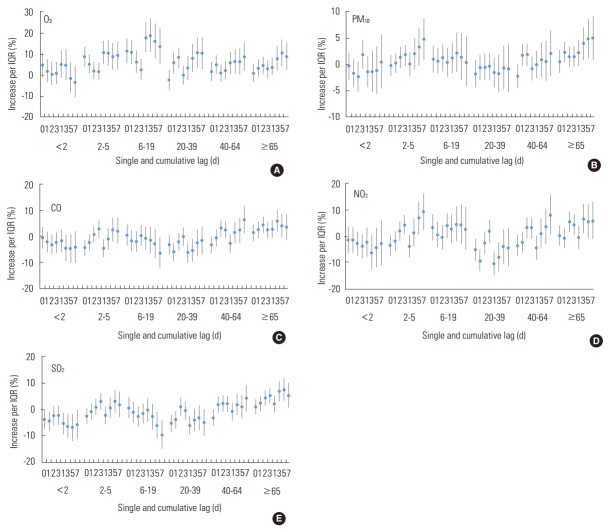
Methods: Data on ED visits from 2005 to 2009 were obtained from the Health Insurance Review and Assessment Service. To evaluate the risk of ED visits for asthma related to ambient air pollutants (carbon monoxide [CO], nitrogen dioxide [NO2], ozone [O3], sulfur dioxide [SO2], and particulate matter with an aerodynamic diameter <10 μm [PM10]), a generalized additive model with a Poisson distribution was used; a single-lag model and a cumulative-effect model (average concentration over the previous 1-7 days) were also explored. The percent increase and 95% confidence interval (CI) were calculated for each interquartile range (IQR) increment in the concentration of each air pollutant. Subgroup analyses were done by age, gender, the presence of allergic disease, and season.

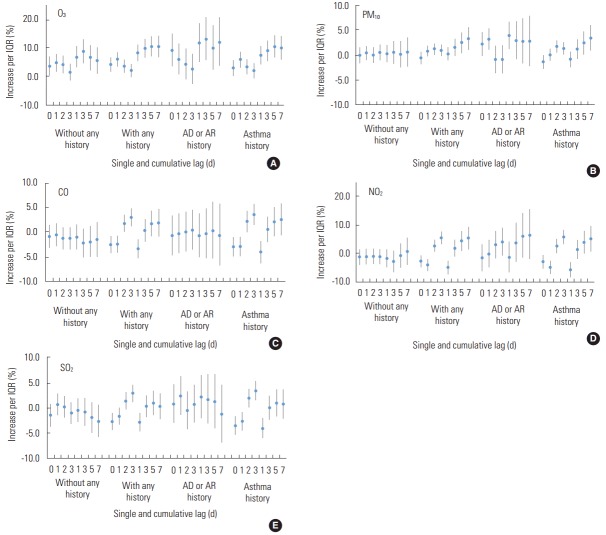
Results: A total of 33 751 asthma attack cases were observed during the study period. The strongest association was a 9.6% increase (95% CI, 6.9% to 12.3%) in the risk of ED visits for asthma per IQR increase in O3 concentration. IQR changes in NO2 and PM10 concentrations were also significantly associated with ED visits in the cumulative lag 7 model. Among patients with a prior history of allergic rhinitis or atopic dermatitis, the risk of ED visits for asthma per IQR increase in PM10 concentration was higher (3.9%; 95% CI, 1.2% to 6.7%) than in patients with no such history.

Conclusions: Ambient air pollutants were positively associated with ED visits for asthma, especially among subjects with a prior history of allergic rhinitis or atopic dermatitis.

Keywords: Air pollution; Asthma; Effect modifier; Emergencies; Korea; Time series analysis.


Conflict of interest statement

The authors have no conflicts of interest associated with the material presented in this paper.

Figures

Figure 1.
Figure 1.
Changes in asthma emergency department visits with interquartile range (IQR) increases in ambient pollutants. (A) Single-lag model. (B) Cumulative-effect model (lags 0-3 used the mean concentrations of lag 0, lag 1, lag 2, and lag 3). O3, ozone; CO, carbon monoxide; NO2, nitrogen dioxide; SO2, sulfur dioxide; PM10, particulate matter with an aerodynamic diameter <10 μm.
Figure 2.
Figure 2.
Percent increases in asthma emergency department (ED) visits with an interquartile range (IQR) increases in ambient pollutants after stratification for gender and season. For all strata, single-lag exposure for the day of the visit and 1, 2, and 3 days prior to the day of the visit were described as the first four digits (0, 1, 2, and 3, respectively). Cumulative lagged exposure, the mean concentrations from the day of visit to all subsequent days, were described as the last four digits (1, 3, 5, and 7, referring to cumulative lag 1, 3, 5, and 7, respectively). The IQR was 22.6 ppb for O3, 0.3 ppm for CO, 18.3 ppb for NO2, 2.8 ppb for SO2, and 35.5 μg/m3 for PM10. Blue dots indicate the percent increase in asthma ED visits, and bars indicate 95% confidence intervals. Spring, March to May; Summer, June to August; Fall, September to November; Winter, December to February; O3, ozone; PM10, particulate matter with an aerodynamic diameter <10 μm; CO, carbon monoxide; NO2, nitrogen dioxide; SO2, sulfur dioxide.
Figure 3.
Figure 3.
Percent increase in asthma emergency department (ED) visits with interquartile range (IQR) increases in ambient pollutants (A: O3, B: PM10, C: CO, D: NO2, and E: SO2) after stratification for age group. For all strata, single-lag exposure for the day of the visit and 1, 2, and 3 days prior to the day of the visit were described as the first four digits (0, 1, 2, and 3, respectively). Cumulative lagged exposure, the mean concentrations from the day of visit to all subsequent days, were described as the last four digits (1, 3, 5, and 7, referring to cumulative lag 1, 3, 5, and 7, respectively). The interquartile IQR was 22.6 ppb for O3, 0.3 ppm for CO, 18.3 ppb for NO2, 2.8 ppb for SO2, and 35.5 μg/m3 for PM10. Blue dots indicate the percent increase in asthma ED visits, and bars indicate 95% confidence intervals. O3, ozone; PM10, particulate matter with an aerodynamic diameter <10 μm; CO, carbon monoxide; NO2, nitrogen dioxide; SO2, sulfur dioxide.
Figure 4.
Figure 4.
Percent increases in asthma emergency department visits with interquartile range (IQR) increases in ambient pollutants (A: O3, B: PM10, C: CO, D: NO2, and E: SO2) after stratification for prior allergic history. For all strata, single-lag exposure for the day of the visit and 1, 2, and 3 days prior to the day of the visit were described as the first four digits (0, 1, 2, and 3, respectively). Cumulative lagged exposure, the mean concentrations from the day of visit to all subsequent days, were described as the last four digits (1, 3, 5, and 7, referring to cumulative lag 1, 3, 5, and 7, respectively). The IQR was 22.6 ppb for O3, 0.3 ppm for CO, 18.3 ppb for NO2, 2.8 ppb for SO2, and 35.5 μg/m3 for PM10. Blue dots indicate the percent increase in asthma ED visits, and bars indicate 95% confidence intervals. AD, atopic dermatitis; AR, allergic rhinitis; O3, ozone; PM10, particulate matter with an aerodynamic diameter <10 μm; CO, carbon monoxide; NO2, nitrogen dioxide; SO2, sulfur dioxide.

References

    1. Oh IH, Yoon SJ, Kim EJ. The burden of disease in Korea. J Korean Med Assoc. 2011;54(6):646–652. (Korean)
    1. OECD Health at a glance 2013: OECD indicators. [cited 2016 Sep 16]. Available from: http://apps.who.int/medicinedocs/documents/s21725en/s21725en.pdf.
    1. Korean Academy of Asthma, Allergy and Clinical Immunology. Korean Academy of Pediatric Allergy and Respiratory Disease. National Strategic Coordinating Center for Clinical Research Korean guideline for asthma. 2015 [cited 2016 Sep 16]. Available from: http://www.allergy.or.kr/file/150527_01.pdf.
    1. Kim SY, Jung JY, Park MS, Kang YA, Kim EY, Kim SK, et al. Increased prevalence of self-reported asthma among Korean adults: an analysis of KNHANES I and IV data. Lung. 2013;191(3):281–288. - PubMed
    1. Clark NA, Demers PA, Karr CJ, Koehoorn M, Lencar C, Tamburic L, et al. Effect of early life exposure to air pollution on development of childhood asthma. Environ Health Perspect. 2010;118(2):284–290. - PMC - PubMed

MeSH terms