. 2016 Oct 20;167(3):695-708.e16.
doi: 10.1016/j.cell.2016.09.035. Epub 2016 Oct 13.

The Landscape of Mouse Meiotic Double-Strand Break Formation, Processing, and Repair

Affiliations

The Landscape of Mouse Meiotic Double-Strand Break Formation, Processing, and Repair

Julian Lange et al. Cell. .

Abstract

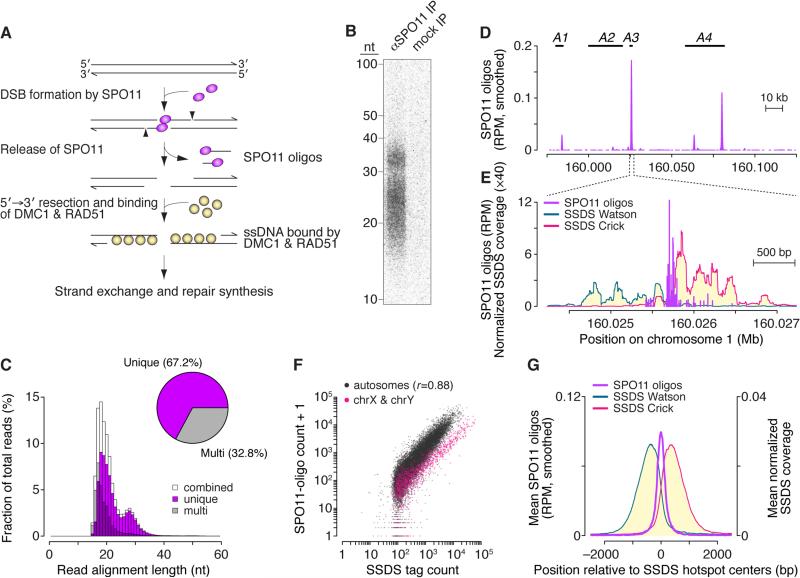
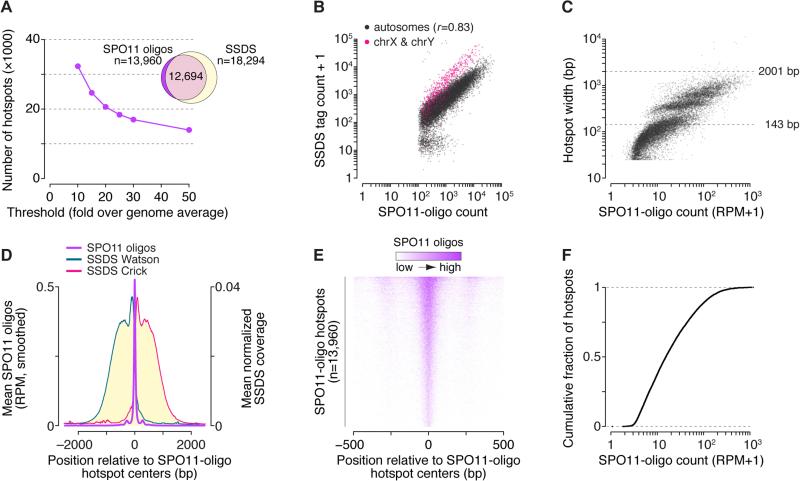
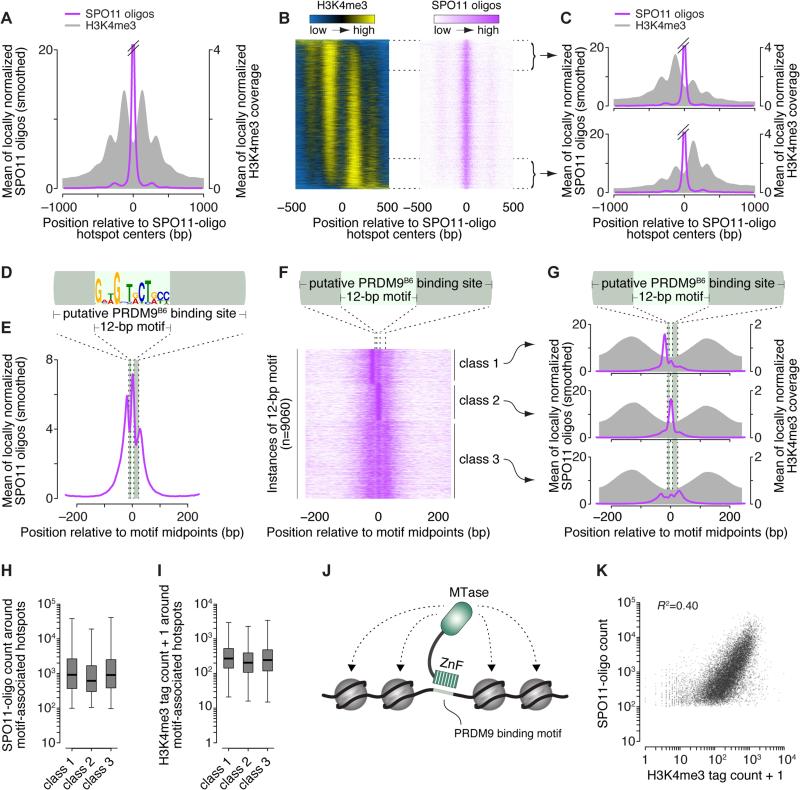
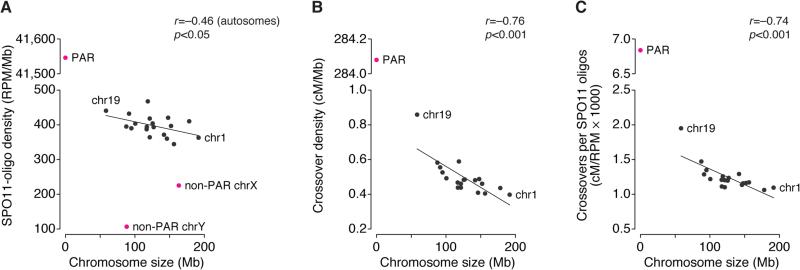
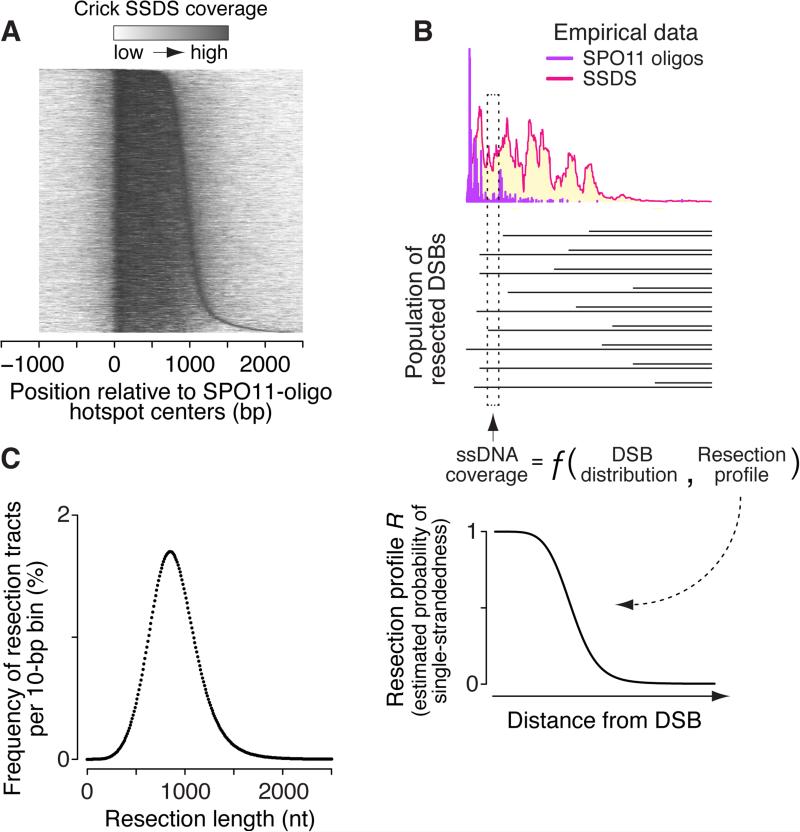
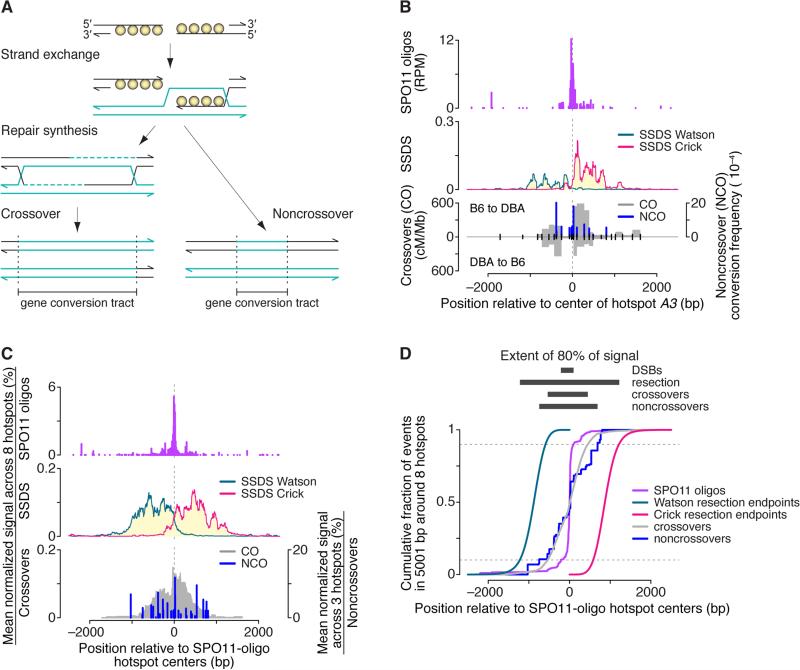
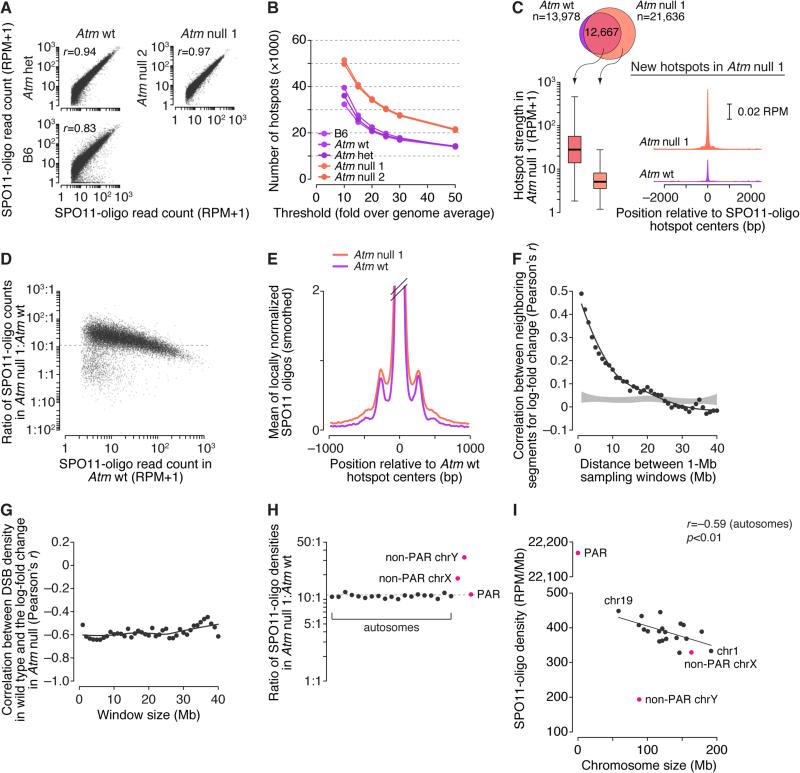
Heritability and genome stability are shaped by meiotic recombination, which is initiated via hundreds of DNA double-strand breaks (DSBs). The distribution of DSBs throughout the genome is not random, but mechanisms molding this landscape remain poorly understood. Here, we exploit genome-wide maps of mouse DSBs at unprecedented nucleotide resolution to uncover previously invisible spatial features of recombination. At fine scale, we reveal a stereotyped hotspot structure-DSBs occur within narrow zones between methylated nucleosomes-and identify relationships between SPO11, chromatin, and the histone methyltransferase PRDM9. At large scale, DSB formation is suppressed on non-homologous portions of the sex chromosomes via the DSB-responsive kinase ATM, which also shapes the autosomal DSB landscape at multiple size scales. We also provide a genome-wide analysis of exonucleolytic DSB resection lengths and elucidate spatial relationships between DSBs and recombination products. Our results paint a comprehensive picture of features governing successive steps in mammalian meiotic recombination.

Keywords: DNA damage; DNA repair; PRDM9; SPO11; chromatin; double-strand break; homologous recombination; meiosis; mouse; resection.


Figures

Figure 1
Figure 1. Nucleotide-Resolution Map of Meiotic DSBs in Wild-Type Mice
(A) Early steps in recombination and the protein–DNA complexes (SPO11 oligos and ssDNA bound by DMC1 and RAD51) used to generate genome-wide recombination initiation maps. (B) SPO11 oligos immunoprecipitated (IP) from B6 mouse spermatocytes, deproteinized, 3′-end-labeled, and resolved in a denaturing 15% polyacrylamide gel. Anti-SPO11 antibody was omitted from the mock IP processed in parallel. (C) Length distribution of SPO11 oligos that map uniquely or to multiple sites. Oligos appear longer on gels (panel B) because of nucleotides added for labeling and amino acid(s) left after SPO11 proteolysis. (D) SPO11-oligo map (smoothed with a 1001-bp Hann filter) compared to positions of four known crossover hotspots (A1–A4) (Table S2A). (E) SPO11 oligos and SSDS coverage (Brick et al., 2012) in a 3001-bp window around hotspot A3. SSDS coverage at each position was normalized to the total strand-specific coverage in the genome and multiplied by 106. See also Figure S1C. (F) In SSDS hotspots (n=18,294), SPO11-oligo counts correlated strongly (Pearson's r) with SSDS tag counts. One SPO11-oligo read was added to permit plotting of hotspots with no oligos. (G) Distribution of SPO11 oligos (51-bp Hann filter) and SSDS coverage around centers of SSDS hotspots. See also Figure S1.
Figure 2
Figure 2. DSB Hotspots Revealed by the SPO11-Oligo Map
(A) Hotspot calling at various thresholds above genome average. Venn diagram shows overlap of SSDS hotspots with the most stringently defined SPO11-oligo hotspots. (B) Good correlation (Pearson's r) between SPO11-oligo counts and SSDS tag counts in 2001-bp windows around SPO11-oligo hotspot centers. (C) Read counts versus widths of SPO11-oligo hotspots. (D) Distribution of SPO11 oligos (51-bp Hann filter) and SSDS coverage around SPO11-oligo hotspot centers. Note different y-axis scale for SPO11 oligos compared to Figure 1G. See also Figure S2E. (E) Heat map of SPO11 oligos (5-bp bins) around hotspot centers, ordered by total read count. Most hotspots display a strong central cluster flanked by weaker peaks on one or both sides. (F) Hotspot intensities vary over a smooth continuum. See also Figure S2.
Figure 3
Figure 3. Spatial Relationships Between PRDM9 Binding, H3K4me3, and DSBs
(A) SPO11 oligos map primarily between methylated nucleosomes. Data were locally normalized by dividing the signal at each base pair by the mean signal within each 2001-bp window, then were averaged across hotspots. The SPO11-oligo profile was smoothed with a 51-bp Hann filter. See also Figure S3A. (B) H3K4me3 is often highly asymmetric around hotspots. Heat maps (data in 5-bp bins) were ordered according to H3K4me3 asymmetry. Data were locally normalized, so color-coding reflects the local spatial pattern, not relative signal strength between hotspots. (C) Similar SPO11-oligo patterns between hotspots with opposite H3K4me3 asymmetry. Each panel shows mean of locally normalized profiles (51-bp Hann filter for SPO11-oligo data) across the 20% of hotspots with the most asymmetric H3K4me3 patterns (left > right in top panel; right > left in bottom panel). See also Figure S3B. (D) The hotspot-enriched 12-bp motif and its disposition within the larger PRDM9B6 binding site. (E) Asymmetric average profile of SPO11 oligos (15-bp Hann filter) around motif midpoints (n=9060). (F) SPO11-oligo spatial classes from k-means clustering. (G) H3K4me3 patterns are similar despite different SPO11-oligo patterns (15-bp Hann filter) between the motif classes from panel F. (H, I) Similar SPO11-oligo counts (F) and H3K4me3 tag counts (G) for hotspots in each of the three PRDM9 motif classes. Counts are for 1001-bp windows around hotspot centers. Boxplots are as defined in Figure S2A legend. In panel I, a value of 1 was added to each hotspot to permit plotting of hotspots with no H3K4me3 tags. (J) Schematic of modular PRDM9 DNA binding and histone methylation activities. ZnF, zinc-finger domain; MTase, methyltransferase domain. (K) H3K4me3 is an imperfect predictor of DSB frequency. SPO11 oligos and H3K4me3 tag counts were summed in the 1001-bp around hotspot centers. One H3K4me3 tag was added to each hotspot to permit plotting of hotspots with no H3K4me3 tags. Eight outliers (H3K4me3 >104) are not shown. See also Figure S3.
Figure 4
Figure 4. Large-Scale Patterns of DSB Formation and Recombination
(A,B) Per unit length, smaller autosomes incur more DSBs (A) and crossovers (B, centimorgans [cM]; data from Froenicke et al., 2002). SPO11-oligo density was exceptionally low in the non-PAR segments of the sex chromosomes, but very high in the PAR. The crossover rate in the PAR was set at 50 cM. (C) The greater crossover density on smaller autosomes is explained only in part by the higher SPO11-oligo density. See also Figure S4 and Table S5.
Figure 5
Figure 5. Analysis of DSB Resection
(A) General resection trends. Heat map shows locally normalized Crick-strand SSDS coverage (10-bp bins) relative to centers of SPO11-oligo hotspots that overlap SSDS hotspots and that have no other hotspot within 5 kb. Hotspots were ordered by distance from 1005 bp left of the center to the point right of the center where cumulative SSDS signal was 90% of total. (B) Combining SPO11-oligo and SSDS data to estimate the length distribution of resection tracts genome-wide. The ssDNA coverage at a given position is a function of the nearby DSB distribution and the per-DSB resection profile R. (C) Estimated resection tract length distribution. See also Figure S5.
Figure 6
Figure 6. Spatial Relationships Between Sequential Steps in Meiotic Recombination
(A) Standard model for meiotic recombination, depicting strand exchange, repair synthesis, and completion of recombination as either a crossover or noncrossover. Note that gene conversion tracts overlap the location of the DSB. (B) Spatial relationships between DSBs (SPO11 oligos), resection (SSDS, normalized coverage; data from Brick et al., 2012), and recombination products at hotspot A3 (Cole et al., 2010). Gray filled areas show density of crossover breakpoints (cM/Mb) detected by allele-specific PCR on sperm DNA using forward primers specific for the B6 haplotype and reverse primers for the DBA haplotype (“B6 to DBA”) or vice versa (“DBA to B6”). Blue bars show noncrossover gene conversion frequencies for individual polymorphisms, from the B6 allele to either DBA or A/J. Noncrossovers usually involve conversion of only a single polymorphism. In the bottom graph, ticks denote tested polymorphisms. See Figure S6 for other hotspots. (C,D) Multi-hotspot composite. Data were locally normalized by dividing by the mean of values in the 5001-bp window encompassing each hotspot, then were averaged across eight hotspots (three for noncrossovers). See STAR Methods for details about hotspots chosen for the composite. In panel D, resection endpoints were based on the estimated genome-wide average. See also Figure S6.
Figure 7
Figure 7. DSB Patterns in the Absence of ATM
(A) Reproducibility of SPO11-oligo maps. SPO11-oligo read counts were summed in 1001-bp windows. (B) Atm null spermatocytes display more hotspots than ATM-proficient spermatocytes. Data for B6 are reproduced from Figure 2A. (C) New hotspots in Atm null are weak hotspots that also yield small numbers of DSBs in wild type. Boxplot is as defined Figure S2A legend; SPO11-oligo profiles were smoothed with a 51-bp Hann filter. (D) In ATM-deficient spermatocytes, weaker hotspots increase more than stronger hotspots. Each point represents a 1001-bp window around a hotspot called in the Atm wt map (one outlier is not shown). The dashed horizontal line marks the 11.3-fold increase in whole-testis SPO11-oligo levels in Atm null mice (Lange et al., 2011). (E) Wider average SPO11-oligo distribution around hotspots in the absence of ATM. SPO11-oligo profiles were smoothed with a 51-bp Hann filter. (F) Local domains of correlated behavior. Each point compares the log-fold change in SPO11-oligo density in 1-Mb segments on autosomes to the log-fold change in neighboring segments the indicated distance away. Shaded area denotes estimated 95% confidence intervals for data randomized within-chromosome. (G) Domains that are relatively DSB-poor in wild type tend to be more strongly suppressed by ATM. Each point compares the log-fold change in SPO11-oligo density in Atm null to the SPO11-oligo density in Atm wt when autosomes are segmented into non-overlapping windows of the indicated size. (H) In the absence of ATM, DSB densities increase more on the non-PAR segments of the sex chromosomes than on autosomes or the PAR. (I) In Atm null spermatocytes, SPO11-oligo density remains negatively correlated with chromosome size, and the X chromosome more closely matches expectation from its size. See also Figure S7.

References

    1. Bailey TL, Gribskov M. Combining evidence using p-values: application to sequence homology searches. Bioinformatics. 1998;14:48–54. - PubMed
    1. Baker CL, Kajita S, Walker M, Saxl RL, Raghupathy N, Choi K, Petkov PM, Paigen K. PRDM9 drives evolutionary erosion of hotspots in Mus musculus through haplotype-specific initiation of meiotic recombination. PLoS Genet. 2015;11:e1004916. - PMC - PubMed
    1. Baker CL, Walker M, Kajita S, Petkov PM, Paigen K. PRDM9 binding organizes hotspot nucleosomes and limits Holliday junction migration. Genome Res. 2014;24:724–732. - PMC - PubMed
    1. Barlow C, Hirotsune S, Paylor R, Liyanage M, Eckhaus M, Collins F, Shiloh Y, Crawley JN, Ried T, Tagle D, et al. Atm-deficient mice: a paradigm of ataxia telangiectasia. Cell. 1996;86:159–171. - PubMed
    1. Baudat F, Imai Y, de Massy B. Meiotic recombination in mammals: localization and regulation. Nat Rev Genet. 2013;14:794–806. - PubMed

Publication types

MeSH terms