. 2016 Nov 7;26(21):2935-2941.
doi: 10.1016/j.cub.2016.08.061. Epub 2016 Oct 13.

Temperature-Robust Neural Function from Activity-Dependent Ion Channel Regulation

Affiliations

Temperature-Robust Neural Function from Activity-Dependent Ion Channel Regulation

Timothy O'Leary et al. Curr Biol. .

Abstract

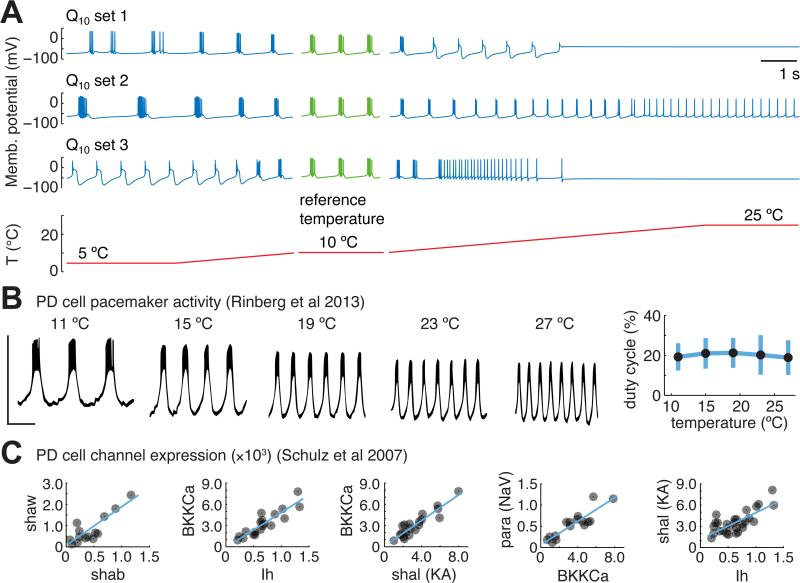
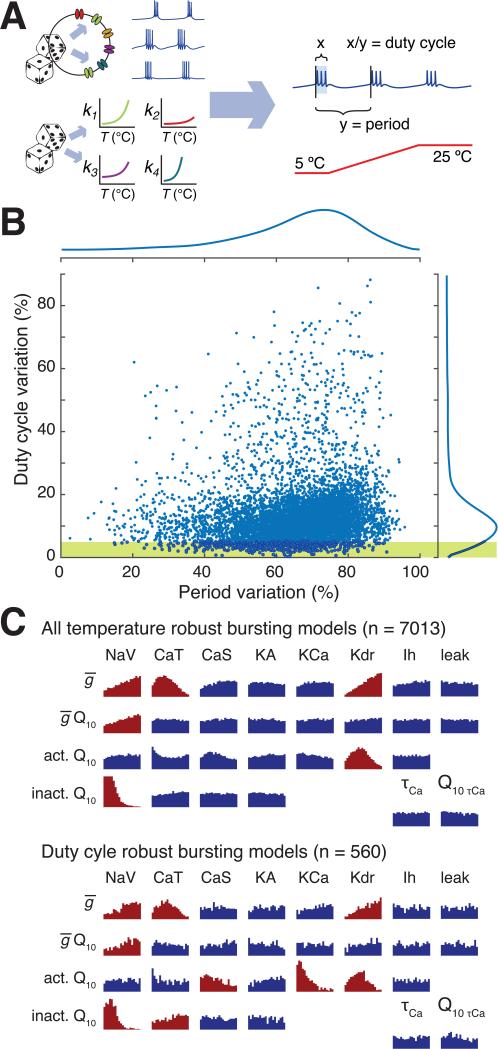
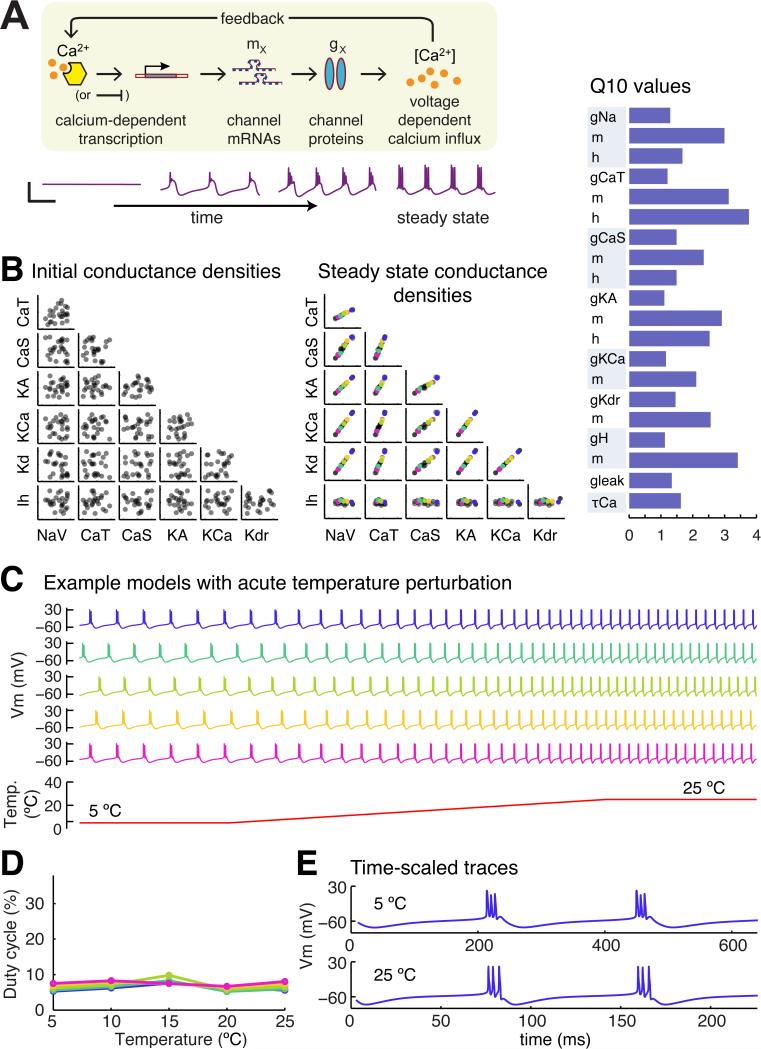
Many species of cold-blooded animals experience substantial and rapid fluctuations in body temperature. Because biological processes are differentially temperature dependent, it is difficult to understand how physiological processes in such animals can be temperature robust [1-8]. Experiments have shown that core neural circuits, such as the pyloric circuit of the crab stomatogastric ganglion (STG), exhibit robust neural activity in spite of large (20°C) temperature fluctuations [3, 5, 7, 8]. This robustness is surprising because (1) each neuron has many different kinds of ion channels with different temperature dependencies (Q10s) that interact in a highly nonlinear way to produce firing patterns and (2) across animals there is substantial variability in conductance densities that nonetheless produce almost identical firing properties. The high variability in conductance densities in these neurons [9, 10] appears to contradict the possibility that robustness is achieved through precise tuning of key temperature-dependent processes. In this paper, we develop a theoretical explanation for how temperature robustness can emerge from a simple regulatory control mechanism that is compatible with highly variable conductance densities [11-13]. The resulting model suggests a general mechanism for how nervous systems and excitable tissues can exploit degenerate relationships among temperature-sensitive processes to achieve robust function.

Keywords: central pattern generator; computational model; crustacean; homeostatic plasticity; ion channels; mathematical model; neuronal excitability; stomatogastric ganglion; temperature compensation.


Figures

Figure 1
Figure 1. Temperature robust neural activity is non-trivial but observed biologically in neurons with highly variable conductance expression
(A) Three example model neurons with identical conductance densities and randomly assigned Q10s for all kinetic parameters (values and ranges in Supplemental Table S1). Conductance densities were chosen to produce bursting pacemaker activity at the reference temperature (green traces). All models are subjected to an identical acute temperature ramp between 5 and 10 °C and between 10 and 25 °C (blue traces); temperature ramp is shown on the same timescale (red trace). (B) Example traces of a pharmacologically isolated PD pacemaker cell in the STG, subjected to acute changes in temperature, reproduced from [2]. Scale bar spans −75 to −25 mV (vertical) and 1 second (horizontal). (Right) summary measurements of PD duty cycle as a function of temperature across 12 different preparations [1]. (C) Single-cell ion channel gene expression data from PD pacemaker neurons, reproduced from [9]. Units are mRNA copy numbers from single cell real-time PCR, normalized to ribosomal RNA. Blue lines are linear fits where significant correlations were found.
Figure 2
Figure 2. Many sets of conductance densities can produce temperature robust neurons with mismatched Q10s
(A) Strategy for sampling temperature-robust combinations of channel densities and Q10s. Both channel densities and Q10s were randomly assigned to 116,400 single compartment models, which were then screened to find temperature robust pacemaking activity by measuring duty cycle and burst period during acute temperature ramps (parameters in Supplemental Table S1). (B) Total variation in cycle period and duty cycle over the temperature range 5 – 25 °C for all 7013 models that maintained bursting across temperature. Total variation is defined as the difference between maximum and minimum cycle period/duty cycle across the temperature range. Marginal distributions of period variation and duty cycle variation are shown to the top and right of the plots. Yellow shaded region shows the subset of models that maintained duty cycle within 5% over the temperature range. (C) (Top panel) Histograms of Q10s for all channel gating variables and maximal conductances, and for calcium buffering time-constant and Q10. For maximal conductances, the horizontal axis ranges from 1.0 to 1.5. For calcium buffer time-constant the range is 20-100 ms. For all other Q10 histograms the range is 1.0 to 4.0. Distributions that deviate substantially from the original uniform sampling distribution are shaded red (Kolmogorov-Smirnov statistic > 0.1.) Conductance abbreviations: NaV = fast sodium, CaT = transient calcium, CaS = slow calcium, KA = A-type potassium, KCa = calcium-activated potasium, Kdr = delayer rectifier potassium, Ih = hyperpolarization-activated mixed cation conductance. (Bottom panel) as for Top panel, but for the subset of 560 models that maintained duty cycle within 5%, as depicted in yellow shaded region of (B).
Figure 3
Figure 3. An example of a self-regulating population of model neurons that establish temperature-robust sets of conductance densities
(A) Cartoon of the conductance regulation model used in this paper. Calcium concentration directly modulates the expression rates of all conductances densities by altering the rate of production of a channel intermediate (‘mRNA’) on an appropriately slow timescale (orders of magnitude slower than fluctuations in calcium due to spikes and membrane potential oscillations). (Lower panel) Example traces showing convergence of the model. Scale bar: 50 mV (vertical), 500 ms (horizontal). See ref [11] for full model details. (B) (Left panel) Random initial conductance densities in 25 model neurons. (Middle panel) Steady-state conductance densities in the same 25 model neurons in the left panel following convergence under the control of one example parameter set from the 2028 parameter sets that produced temperature-robust self-regulating neurons. (Right panel) Q10 values of the conductances in the model neurons in the left and middle panels. (C) Acute temperature ramps in five example model neurons selected from the steady-state population in (B). (D) Quantification of duty cycle in the five example neurons in (C) as a function of temperature. (E) Time-stretched membrane potential traces from the blue model neuron in (C).

Comment in

References

    1. Rajan K, Abbott LF. Temperature-compensated chemical reactions. Physical Review E. 2007;75(2):022902. - PubMed
    1. Hong CI, Tyson JJ. A proposal for temperature compensation of the circadian rhythm in Drosophila based on dimerization of the per protein. Chronobiology International. 1997;14:521–529. - PubMed
    1. Rinberg A, Taylor AL, Marder E. The effects of temperature on the stability of a neuronal oscillator. PLoS computational biology. 2013;9:e1002857. - PMC - PubMed
    1. Robertson RM, Money TG. Temperature and neuronal circuit function: compensation, tuning and tolerance. Curr Opin Neurobiol. 2012;22:724–734. - PubMed
    1. Roemschied FA, Eberhard MJ, Schleimer JH, Ronacher B, Schreiber S. Cell-intrinsic mechanisms of temperature compensation in a grasshopper sensory receptor neuron. Elife. 2014;3:e02078. - PMC - PubMed

Publication types

LinkOut - more resources