. 2016 Nov 8;24(5):716-727.
doi: 10.1016/j.cmet.2016.09.006. Epub 2016 Oct 13.

Environment Dictates Dependence on Mitochondrial Complex I for NAD+ and Aspartate Production and Determines Cancer Cell Sensitivity to Metformin

Affiliations

Environment Dictates Dependence on Mitochondrial Complex I for NAD+ and Aspartate Production and Determines Cancer Cell Sensitivity to Metformin

Dan Y Gui et al. Cell Metab. .

Abstract

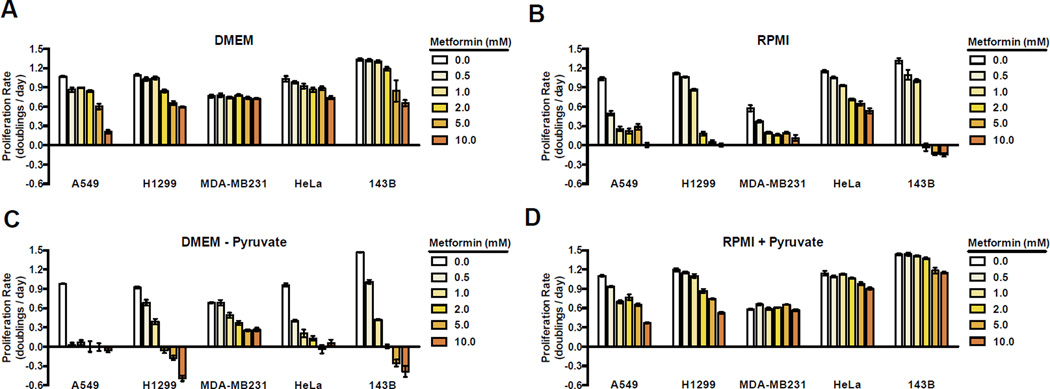
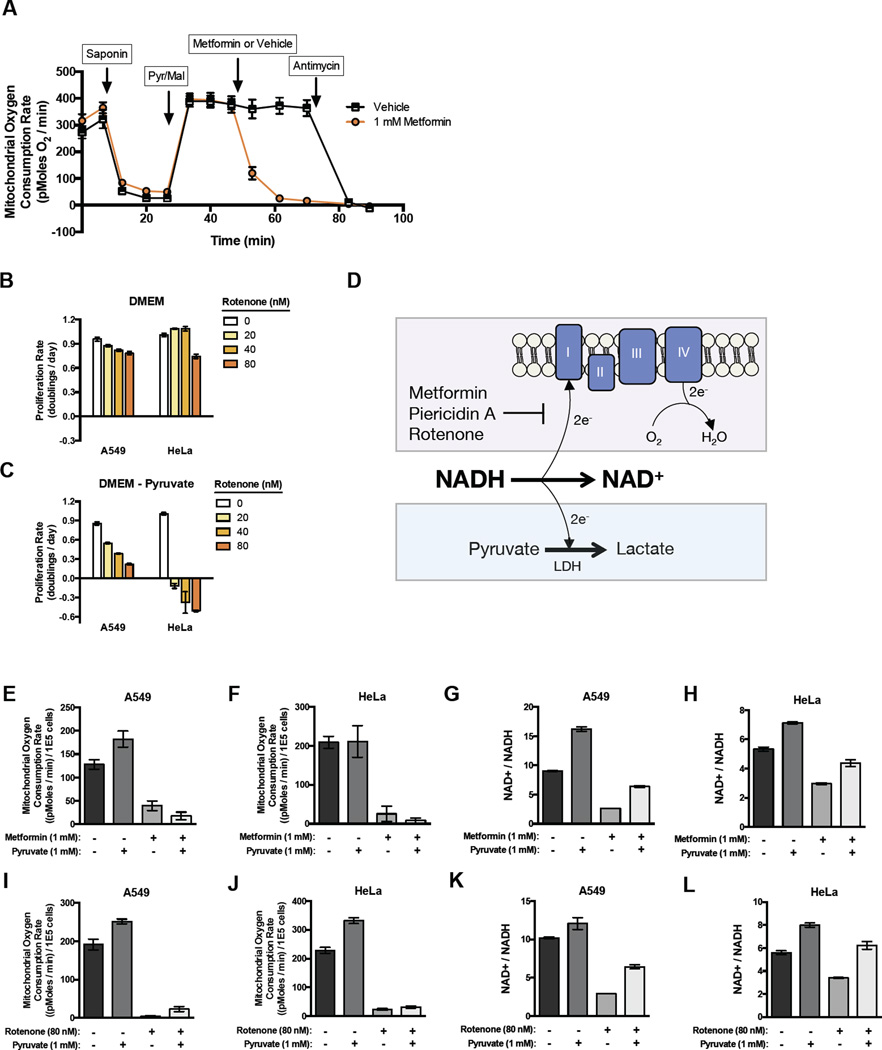
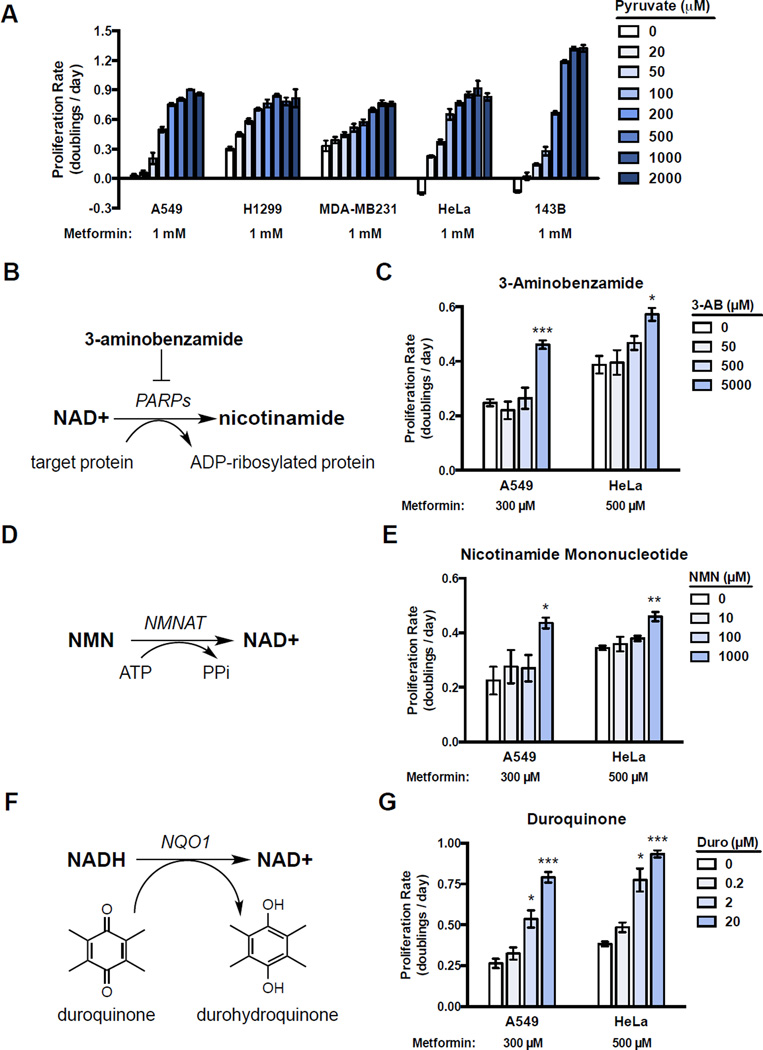
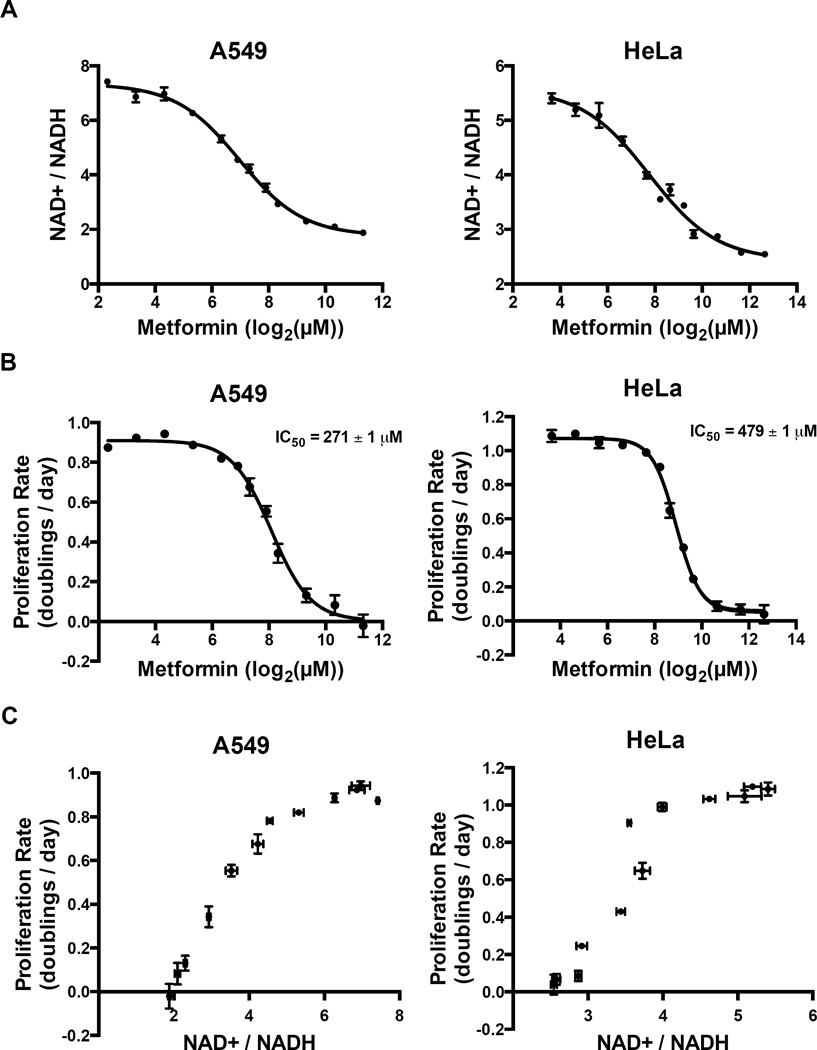
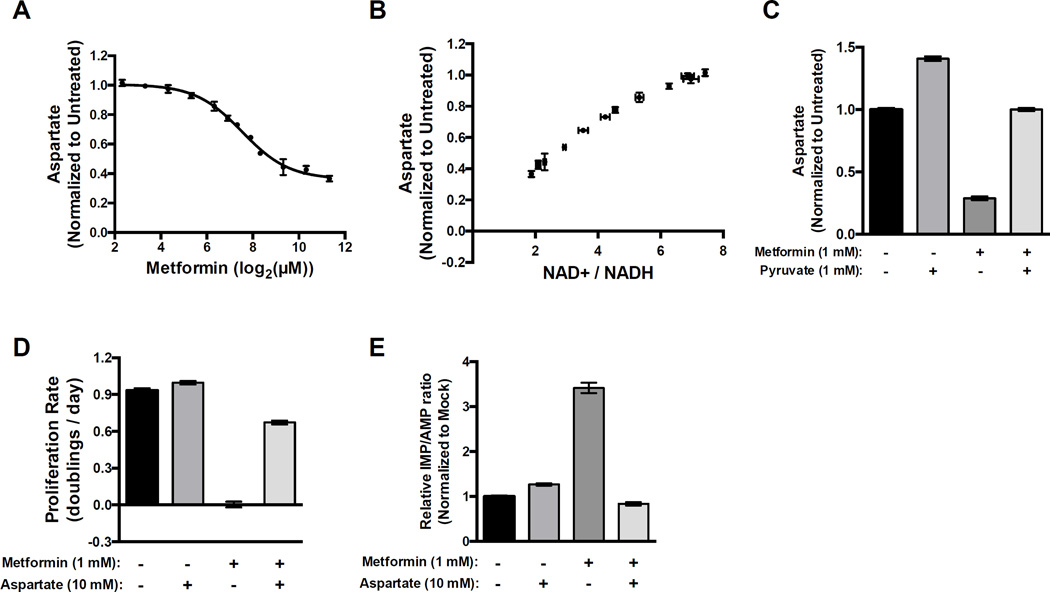
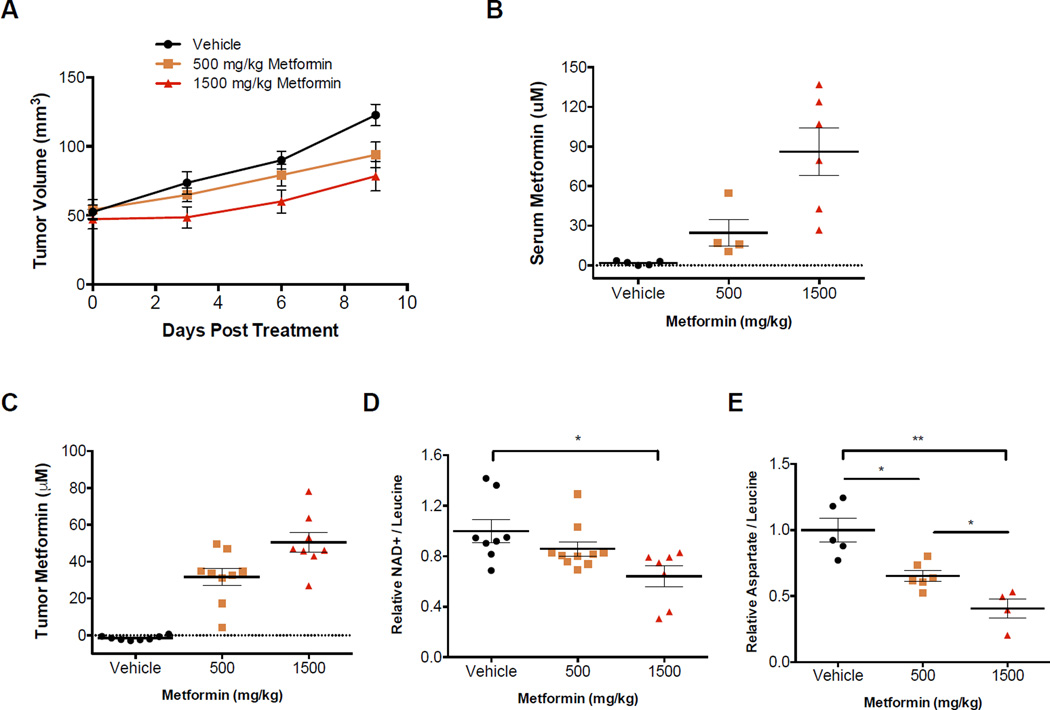
Metformin use is associated with reduced cancer mortality, but how metformin impacts cancer outcomes is controversial. Although metformin can act on cells autonomously to inhibit tumor growth, the doses of metformin that inhibit proliferation in tissue culture are much higher than what has been described in vivo. Here, we show that the environment drastically alters sensitivity to metformin and other complex I inhibitors. We find that complex I supports proliferation by regenerating nicotinamide adenine dinucleotide (NAD)+, and metformin's anti-proliferative effect is due to loss of NAD+/NADH homeostasis and inhibition of aspartate biosynthesis. However, complex I is only one of many inputs that determines the cellular NAD+/NADH ratio, and dependency on complex I is dictated by the activity of other pathways that affect NAD+ regeneration and aspartate levels. This suggests that cancer drug sensitivity and resistance are not intrinsic properties of cancer cells, and demonstrates that the environment can dictate sensitivity to therapies that impact cell metabolism.

Keywords: NAD+/NADH ratio; aspartate; biguanide; cancer metabolism; complex I; drug sensitivity; metformin; mitochondria.


Figures

Figure 1
Figure 1. Pyruvate suppresses the antiproliferative effects of metformin
Proliferation rates for A549, H1299, MDA-MB231, HeLa, and 143B cells in media treated with the indicated concentrations of metformin. Cells were cultured in DMEM (A), RPMI 1640 (B), DMEM without pyruvate (C), and RPMI 1640 supplemented with 1 mM pyruvate (D). Values denote mean ± standard error of the mean (SEM). n=3. See also Figure S1.
Figure 2
Figure 2. Complex I activity is dispensable when exogenous pyruvate is available to act as an electron acceptor
(A) Mitochondrial oxygen consumption of A549 cells following permeabilization by saponin, addition of pyruvate and malate, addition of either metformin or vehicle, and addition of antimycin as indicated. Proliferation rates for A549 and HeLa cells treated with indicated dose of complex I inhibitor rotenone in DMEM (B) or DMEM without pyruvate (C). (D) Schematic illustrating how oxygen allows cells to regenerate NAD+ from NADH via complex I activity and the site of action of complex I inhibitors. Exogenous pyruvate provides an alternate way to regenerate NAD+ through lactate dehydrogenase (LDH) activity. Mitochondrial oxygen consumption rates of A549 (E) and HeLa (F) cells treated with the indicated concentrations of metformin and pyruvate. Intracellular NAD+/NADH ratios of A549 (G) and HeLa (H) cells treated with the indicated concentrations of metformin and pyruvate. Mitochondrial oxygen consumption rates of A549 (I) and HeLa (J) cells treated with the indicated concentrations of rotenone and pyruvate. Intracellular NAD+/NADH ratios of A549 (K) and HeLa (L) cells treated with the indicated concentrations of rotenone and pyruvate. Values denote mean ± SEM. n=5 (A, E-F, I-J) n=3 (B, G-H, K-L). See also Figure S2.
Figure 3
Figure 3. Altering cellular NAD+/NADH ratio titrates dependency on complex I activity
(A) Proliferation rates for A549, H1299, MDA-MB231, HeLa, and 143B cells treated with 1 mM metformin and supplemented with the indicated amounts of pyruvate. (B) Schematic illustrating how poly(ADP-ribose) polymerases (PARPs) consume NAD+. (C) Proliferation rates of A549 and HeLa cells treated with metformin at the indicated concentration in media supplemented with the indicated concentration PARP inhibitor 3-aminobenzamide (3-AB). (D) Schematic illustrating how nicotinamide mononucleotide (NMN) supplementation can increase NAD+ synthesis by nicotinamide mononucleotide adenylyltransferase (NMNAT) activity. (E) Proliferation rates of metformin treated A549 and HeLa cells supplemented with the indicated concentration of NMN. (F) Schematic illustrating how duroquinone can oxidize NADH to yield NAD+ and durohydroquinone by the activity of NAD(P)H dehydrogenase, quinone 1 (NQO1). (G) Proliferation rates of metformin treated A549 and HeLa cells supplemented with the indicated concentration of duroquinone. Values denote mean ± SEM. n=3. *p < 0.05, **p < 0.01, ***p < 0.001. See also Figure S3.
Figure 4
Figure 4. NAD+/NADH ratio tracks with proliferation rate in metformin treated cells
Intracellular NAD+/NADH ratios (A) and proliferation rates (B) were measured after treatment with metformin at the indicated doses in A549 cells and HeLa cells. Proliferation rates and NAD+/NADH ratios were plotted independent of metformin concentrations to determine the relationship between NAD+/NADH ratio and proliferation rate in A549 cells and HeLa cells, respectively (C). Values denote mean ± SEM. n=3. See also Figure S4.
Figure 5
Figure 5. The antiproliferative effects of metformin are suppressed by exogenous aspartate
(A) Intracellular aspartate levels were measured after treatment with metformin at the indicated doses in A549 cells. (B) Aspartate levels and NAD+/NADH ratios were plotted independent of metformin concentrations to determine the relationship between NAD+/NADH ratio and aspartate levels in A549 cells. (C) Intracellular aspartate levels in A549 cells treated with the indicated doses of metformin and pyruvate. (D) Proliferation rates of A549 treated with the indicated doses of metformin and exogenous aspartate. (E) Normalized IMP/AMP ratio in A549 treated with the indicated doses of metformin and exogenous aspartate. Values denote mean ± SEM. n=3. See also Figure S5.
Figure 6
Figure 6. Metformin slows tumor growth and decreases intratumoral NAD+ and aspartate levels
(A) A549 xenografts in nude mice were treated with vehicle or the indicated doses of metformin, once a day by oral gavage. (B) Serum and (C) tumor metformin concentrations measured in material from mice treated for 10 days at the indicated dose of metformin, with tissue harvested 2 hours after the last dose. Relative intratumoral (D) NAD+ and (E) aspartate levels after 10 days of vehicle or metformin treatment at the indicated dose. Relative NAD+ and aspartate levels are shown as NAD+ and aspartate total ion counts (TIC) normalized to leucine TIC. Values denote mean ± SEM. *p < 0.05, **p < 0.01. Related to Figure S6.

References

    1. Andrzejewski S, Gravel SP, Pollak M, St-Pierre J. Metformin directly acts on mitochondria to alter cellular bioenergetics. Cancer & metabolism. 2014;2:12. - PMC - PubMed
    1. Bai P, Canto C, Oudart H, Brunyanszki A, Cen Y, Thomas C, Yamamoto H, Huber A, Kiss B, Houtkooper RH, et al. PARP-1 inhibition increases mitochondrial metabolism through SIRT1 activation. Cell Metab. 2011;13:461–468. - PMC - PubMed
    1. Birsoy K, Possemato R, Lorbeer FK, Bayraktar EC, Thiru P, Yucel B, Wang T, Chen WW, Clish CB, Sabatini DM. Metabolic determinants of cancer cell sensitivity to glucose limitation and biguanides. Nature. 2014;508:108–112. - PMC - PubMed
    1. Birsoy K, Sabatini DM, Possemato R. Untuning the tumor metabolic machine: Targeting cancer metabolism: a bedside lesson. Nature medicine. 2012;18:1022–1023. - PubMed
    1. Birsoy K, Wang T, Chen WW, Freinkman E, Abu-Remaileh M, Sabatini DM. An Essential Role of the Mitochondrial Electron Transport Chain in Cell Proliferation Is to Enable Aspartate Synthesis. Cell. 2015;162:540–551. - PMC - PubMed