. 2016 Nov 8;24(5):728-739.
doi: 10.1016/j.cmet.2016.09.005. Epub 2016 Oct 13.

Metformin Targets Central Carbon Metabolism and Reveals Mitochondrial Requirements in Human Cancers

Affiliations

Metformin Targets Central Carbon Metabolism and Reveals Mitochondrial Requirements in Human Cancers

Xiaojing Liu et al. Cell Metab. .

Abstract

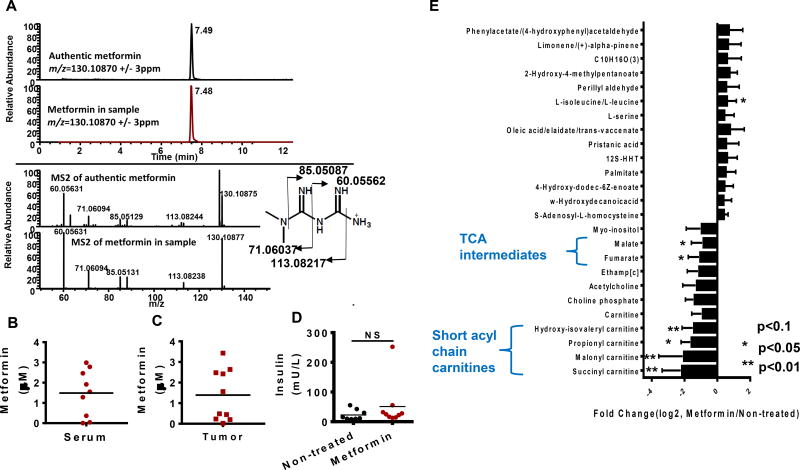
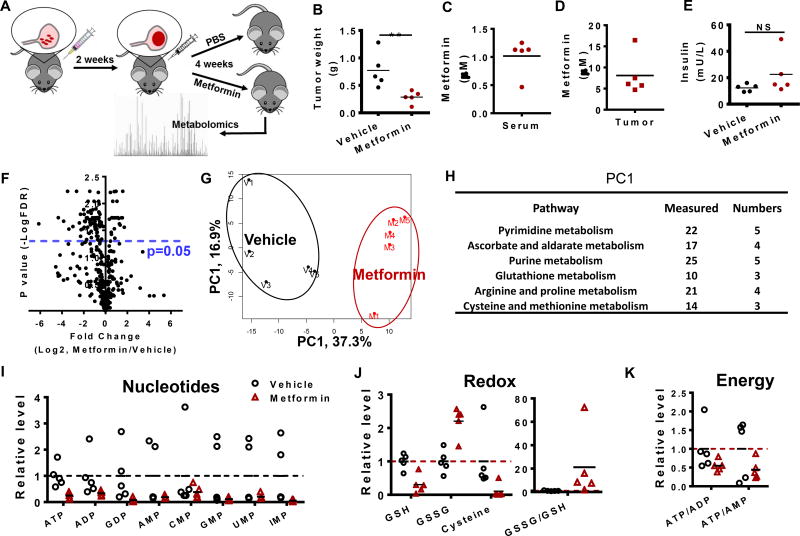
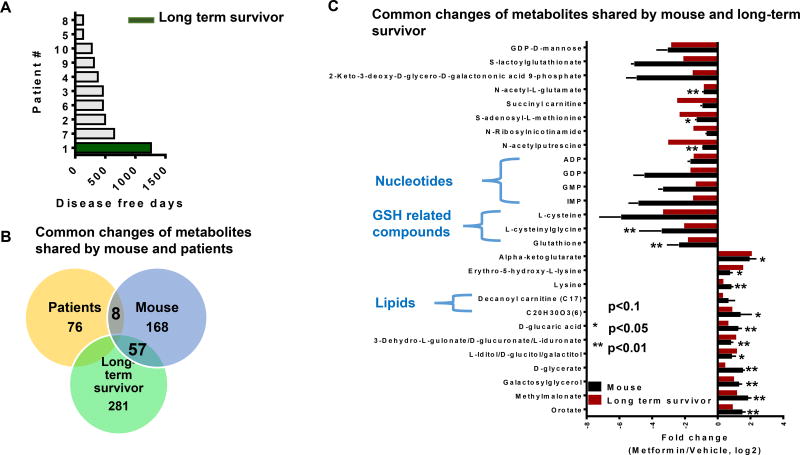
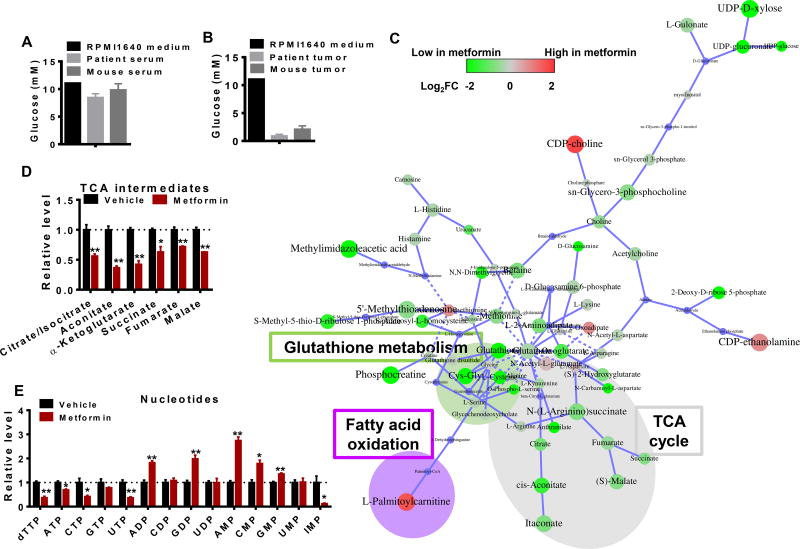
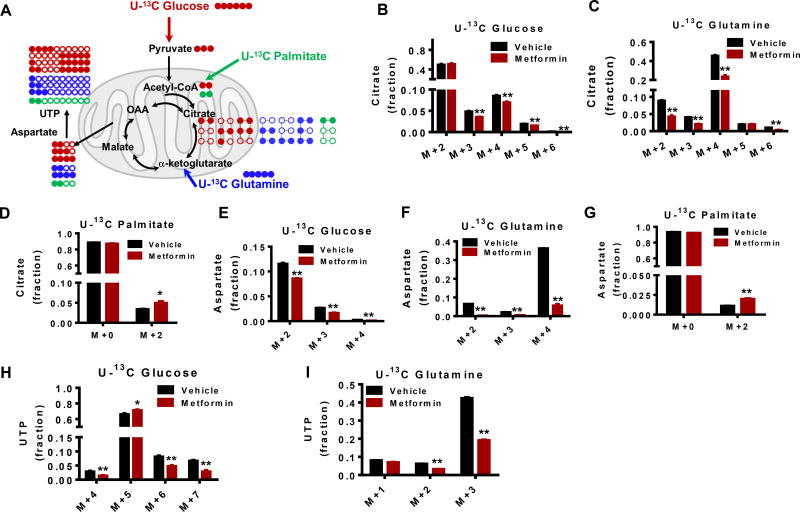
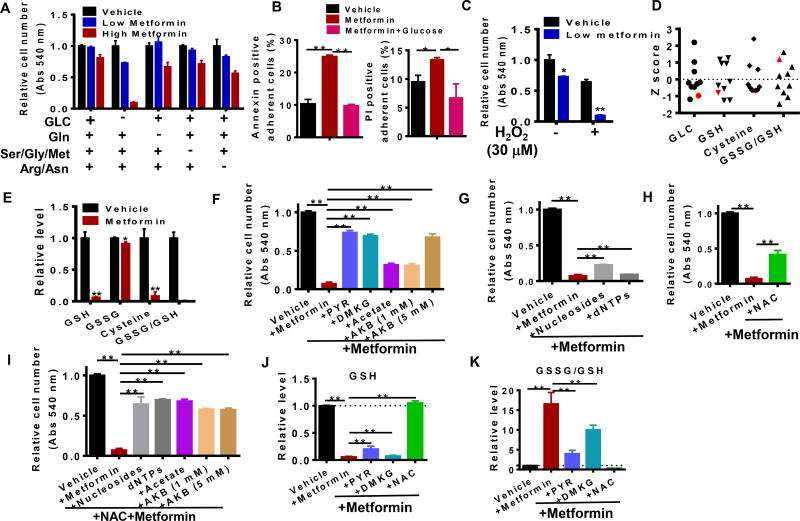
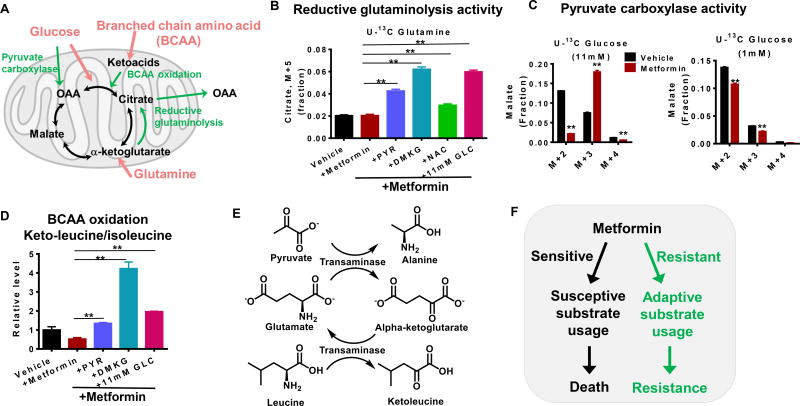
Repurposing metformin for cancer therapy is attractive due to its safety profile, epidemiological evidence, and encouraging data from human clinical trials. Although it is known to systemically affect glucose metabolism in liver, muscle, gut, and other tissues, the molecular determinants that predict a patient response in cancer remain unknown. Here, we carry out an integrative metabolomics analysis of metformin action in ovarian cancer. Metformin accumulated in patient biopsies, and pathways involving nucleotide metabolism, redox, and energy status, all related to mitochondrial metabolism, were affected in treated tumors. Strikingly, a metabolic signature obtained from a patient with an exceptional clinical outcome mirrored that of a responsive animal tumor. Mechanistically, we demonstrate with stable isotope tracing that these metabolic signatures are due to an inability to adapt nutrient utilization in the mitochondria. This analysis provides new insights into mitochondrial metabolism and may lead to more precise indications of metformin in cancer.

Keywords: cell proliferation; flux analysis; mass spectrometry; metabolomics; mitochondria; network analysis; ovarian cancer; systems biology.


Conflict of interest statement

DISCLOSURES

The authors declare no conflicts of interest at this time.

Figures

Figure 1
Figure 1. Altered mitochondrial metabolism in human ovarian tumors from patients taking metformin
A. Extracted ion chromatogram of authentic standard metformin (top) and metformin extracted from mouse serum (bottom) with an m/z window of 6 ppm (+/− 3ppm). MS2 spectrum of authentic metformin (top) and metformin extracted from mouse serum (bottom). B. Metformin levels in serum of ovarian cancer (OvCa) patients. C. Metformin concentration in ovarian tumors from patients. D. Insulin levels in the serum of OvCa patients after overnight fasting. E. Metabolites with trending changes (p<0.1, * p<0.05, ** p<0.01, student’s t-test two tailed) in tumors from patients on metformin compared to tumor not exposed to metformin treatment (N=10). The fold change is calculated by dividing MS intensity (integrated peak area of metabolites) values of each metabolite in metformin treated patient tumors by those with no metformin treatment. Error bars obtained from SEM of n=10 independent measurements.
Figure 2
Figure 2. Metformin directly suppress tumor mitochondrial metabolism in mouse ovarian tumors
A. Description of timeline and treatment of the ovarian cancer model where HeyA8 cells are injected intraperitoneally. B. Mouse tumor weight (N=5). C. Metformin concentration in mouse serum. D. Metformin concentration in mouse tumor. E. Insulin levels in mouse serum. F. Volcano plot of metabolites in mouse tumor. G. PCA analysis of metabolites in mouse tumor. H. Pathway analysis of metabolites in mouse tumor. “Measured” is the total number of metabolites detected in mouse tumor, while “Number” is the number of metabolites with significant changes (p<0.05) in the metformin treatment group. I to K. Representative metabolites among nucleotides, redox and energy state. * p<0.05, ** p<0.01
Figure 3
Figure 3. Metabolite changes are shared by patient and mouse in response to metformin treatment
A. Disease free days of ten patients on metformin. The long term survivor patient is the one with longest disease free days shown in green. B. Number of metabolites overlapped in patients and mouse tumor with larger effects in the metformin treatment group (fold change >2 or <0.6). This number indicates the number of metabolites with changes in response to metformin treatment. C. Representative metabolites sharing similar changes in response to metformin treatment in mouse (p<0.1, * p<0.05, ** p<0.01) and a long term survivor patient tumor. Error bars obtained from SEM of n=5 independent measurements.
Figure 4
Figure 4. In vivo metabolite profiles of metformin treatment can be modeled in a glucoselimited environment
A. Glucose concentrations in RPMI medium, patient and mouse serum. B. Glucose concentration in RPMI medium, patient and mouse ovarian tumors. C. Network of significant metabolic changes in ovarian cancer cells in response to Metformin treatment. The node size represents p value while the color represents the fold change. The size of the node indicates magnitude of the change. Red represents metabolites that are higher in metformin treated cells, while green denotes lower in metformin treated cells. D to E. Representative metabolites among TCA and nucleotides. Relative level was calculated by dividing MS intensity of each metabolite by corresponding MS intensity in Vehicle. * p<0.05, ** p<0.01 Error bars obtained from SEM of n=3 independent measurements.
Figure 5
Figure 5. Metabolite profiles of metformin are the result of altered substrate utilization in the mitochondria
A. 13C enrichment patterns that are derived from different 13C labeled fuel sources. Solid circle denotes 13C carbon while open circle denotes 12C carbon. B to D. 13C isotopologues distribution of citrate from cells treated with 13C labeled glucose, glutamine or palmitate for 6 hrs. E to G. 13C enrichment in aspartate from 13C labelled glucose, glutamine or palmitate. H to I. UTP 13C distribution in the presence of 13C labelled glucose or glutamine. 13C labelled UTP was not detected from 13C labeled palmitate. * p<0.05, ** p<0.01 Error bars obtained from SEM of n=3 independent measurements.
Figure 6
Figure 6. Metformin response and resistance depends on the availability of specific nutrients
A. Response to metformin treatment in different medium conditions. Abs: Absorbance (at 540 nm from MTT assay). GLC: Glucose (11 mM), Gln: Glutamine, Ser/Gly/Met: Serine, glycine and methionine, Arg/Asn: Arginine and Asparagine. Low metformin: 0.5 mM metformin, High metformin: 1.5 mM metformin. B. Metformin effect on cell proliferation in the presence of low glucose (1mM) and/or hydrogen peroxide (H2O2, 30 µM). C. Annexin and PI positive populations of adherent cells after 40 hours of metformin treatment. D. Z score distribution of glucose (GLC) and redox metabolites (GSH, cysteine and GSSG/GSH) in patients after metformin treatment. The long term survivor is highlighted in red color. E. Relative levels of redox metabolites in ovarian cancer cells with or without metformin treatment for 24 hrs. F. Cell viability in the presence of metformin and precursors of the TCA cycle (PYR: pyruvate; DMKG: dimethyl α-ketoglutarate; Acetate: sodium acetate; AKB: α-ketobutyrate). G. Rescue of metformin-induced loss of cell viability by nucleosides or deoxynucleotide triphosphates (dNTPs). H to I. Cell viability in various medium with or without N-acetylcysteine (NAC). J to K. Redox status in different treatment conditions. * p<0.05, ** p<0.01 Error bars obtained from SEM of n=3 independent measurements.
Figure 7
Figure 7. The response to metformin depends on whether substrate utilization in the mitochondria is flexible
A. Schematic of substrate utilization. The adaptive pathways under mitochondrial stress are highlighted in green color. OAA: oxaloacetate, Keto acids: ketoleucine/ketoisoleucine. B. Reductive glutaminolysis activity as represented by the fraction of 13C enriched citrate isotopologue (M+5) from cells treated with 13C-glutamine in different medium conditions. C. Pyruvate carboxylase activity as estimated by the fraction of malate (M+3) from cells treated with 13C-glucose in different medium conditions. D. Ketoleucine/ketoisoleucine levels in different media conditions, representing BCAA oxidation. E. Representative metabolite enrichment pattern from U-13C pyruvate treated cells. F. Scheme of coupled transamination reactions demonstrating stoichiometric alpha-ketoglutarate generation from alanine labeling. G. Model of resistant and sensitive response to metformin treatment. * p<0.05, ** p<0.01 Error bars obtained from SEM of n=3 independent measurements.

References

    1. Birsoy K, Possemato R, Lorbeer FK, Bayraktar EC, Thiru P, Yucel B, Wang T, Chen WW, Clish CB, Sabatini DM. Metabolic determinants of cancer cell sensitivity to glucose limitation and biguanides. Nature. 2014;508:108–112. - PMC - PubMed
    1. Birsoy K, Wang T, Chen WW, Freinkman E, Abu-Remaileh M, Sabatini DM. An Essential Role of the Mitochondrial Electron Transport Chain in Cell Proliferation Is to Enable Aspartate Synthesis. Cell. 2015;162:540–551. - PMC - PubMed
    1. Cabreiro F, Au C, Leung KY, Vergara-Irigaray N, Cocheme HM, Noori T, Weinkove D, Schuster E, Greene ND, Gems D. Metformin retards aging in C. elegans by altering microbial folate and methionine metabolism. Cell. 2013;153:228–239. - PMC - PubMed
    1. Camacho L, Dasgupta A, Jiralerspong S. Metformin in breast cancer - an evolving mystery. Breast cancer research : BCR. 2015;17:88. - PMC - PubMed
    1. Cardaci S, Zheng L, MacKay G, van den Broek NJ, MacKenzie ED, Nixon C, Stevenson D, Tumanov S, Bulusu V, Kamphorst JJ, et al. Pyruvate carboxylation enables growth of SDH-deficient cells by supporting aspartate biosynthesis. Nat Cell Biol. 2015;17:1317–1326. - PMC - PubMed

Publication types