. 2016 Nov 23;92(4):916-928.
doi: 10.1016/j.neuron.2016.09.032. Epub 2016 Oct 13.

Identified Cellular Correlates of Neocortical Ripple and High-Gamma Oscillations during Spindles of Natural Sleep

Affiliations

Identified Cellular Correlates of Neocortical Ripple and High-Gamma Oscillations during Spindles of Natural Sleep

Robert G Averkin et al. Neuron. .

Abstract

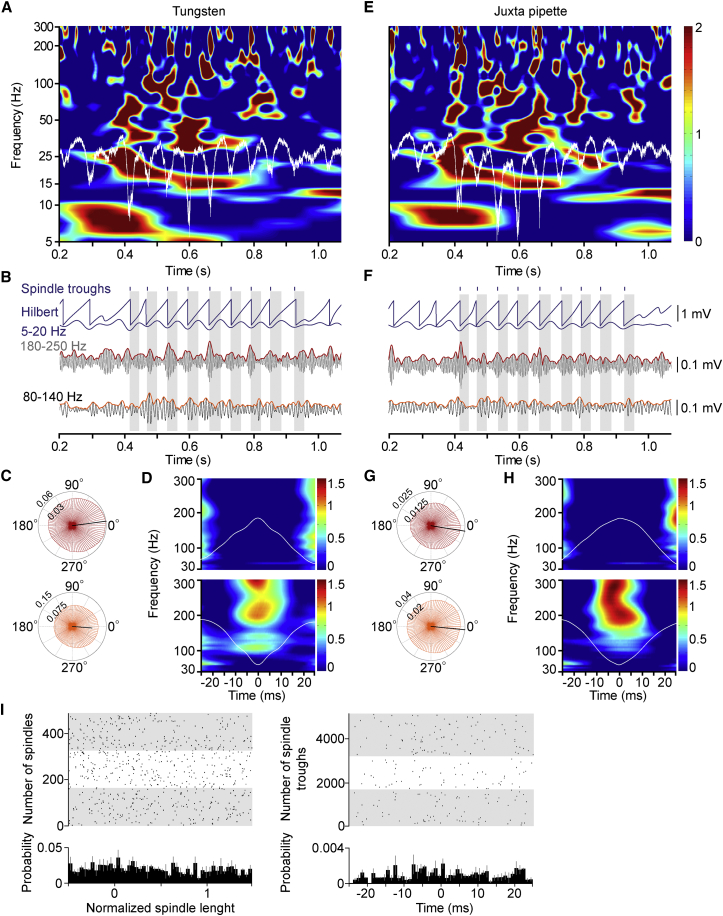
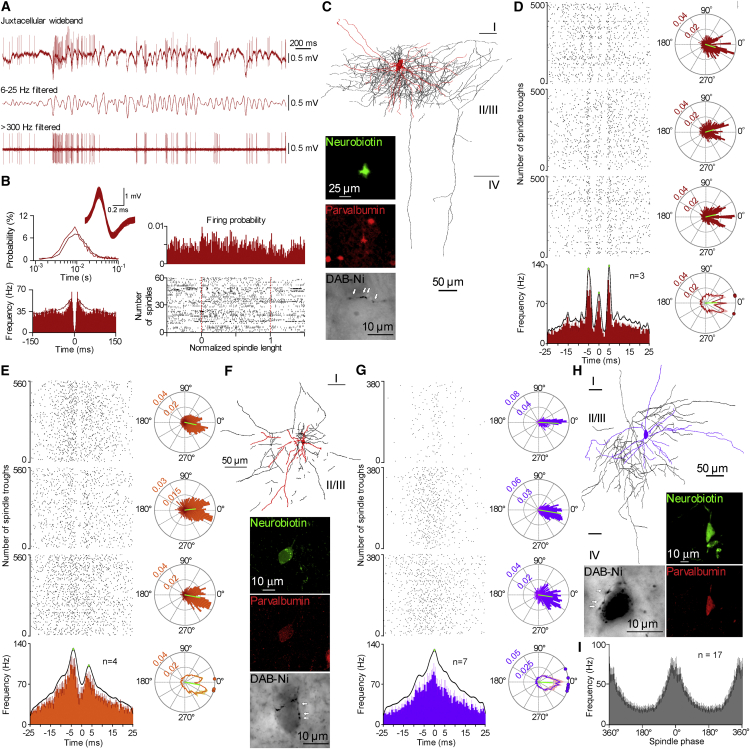
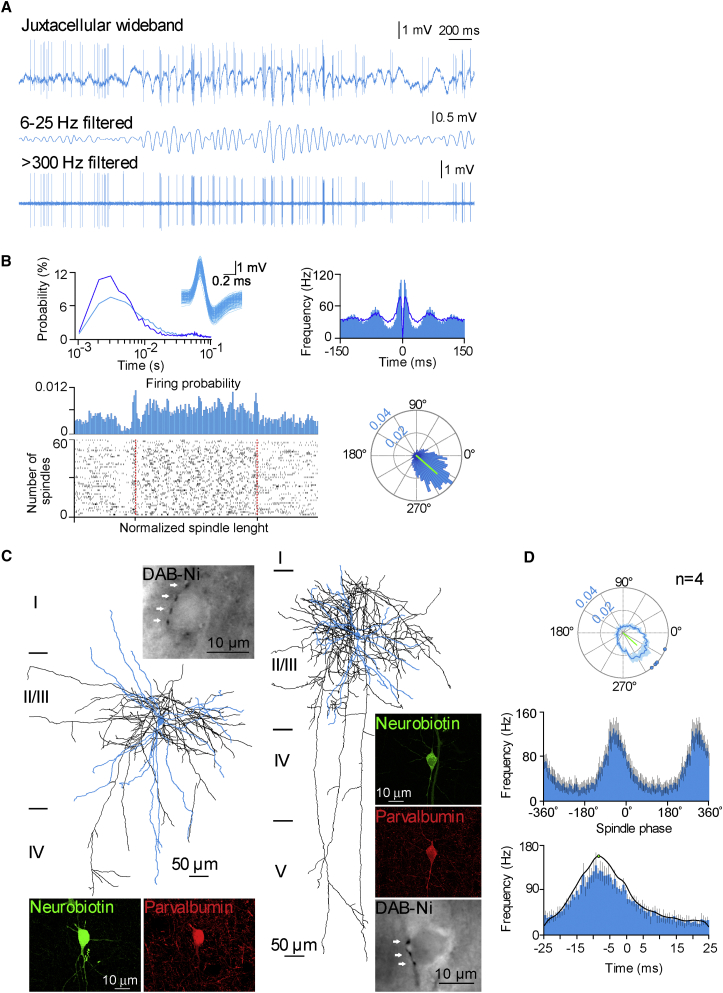
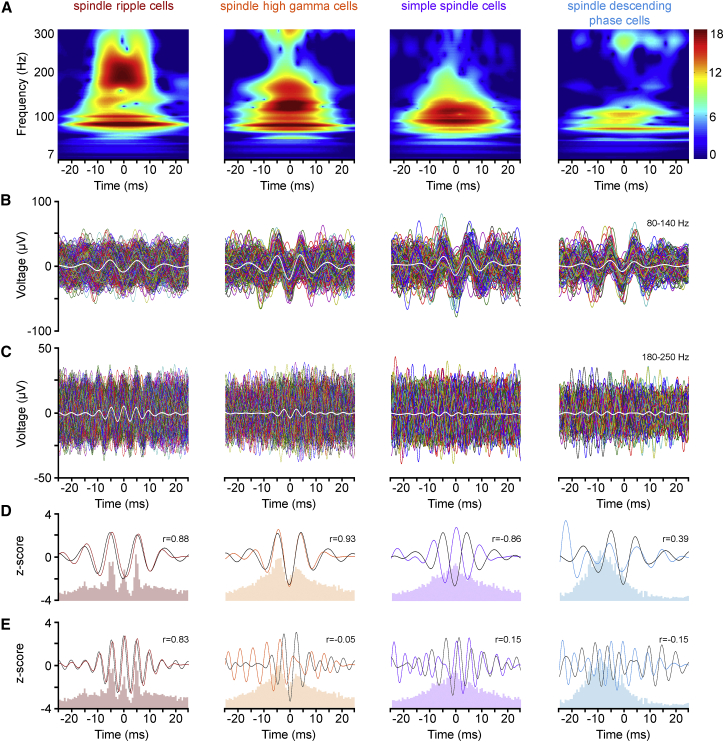
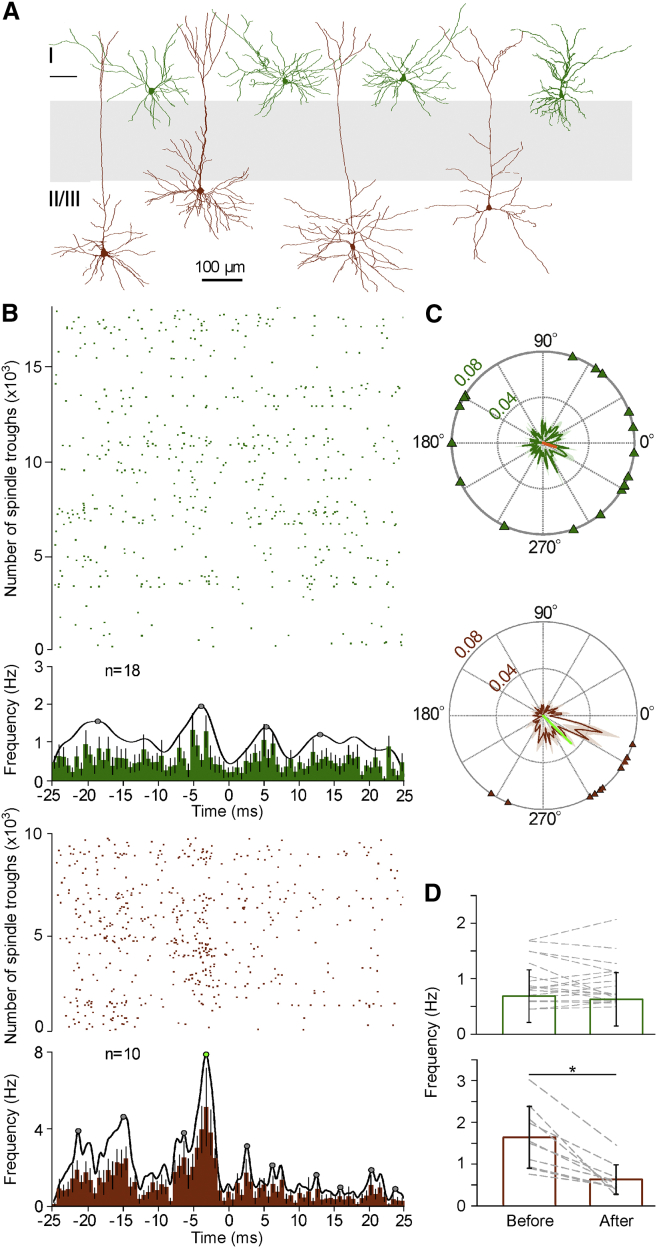
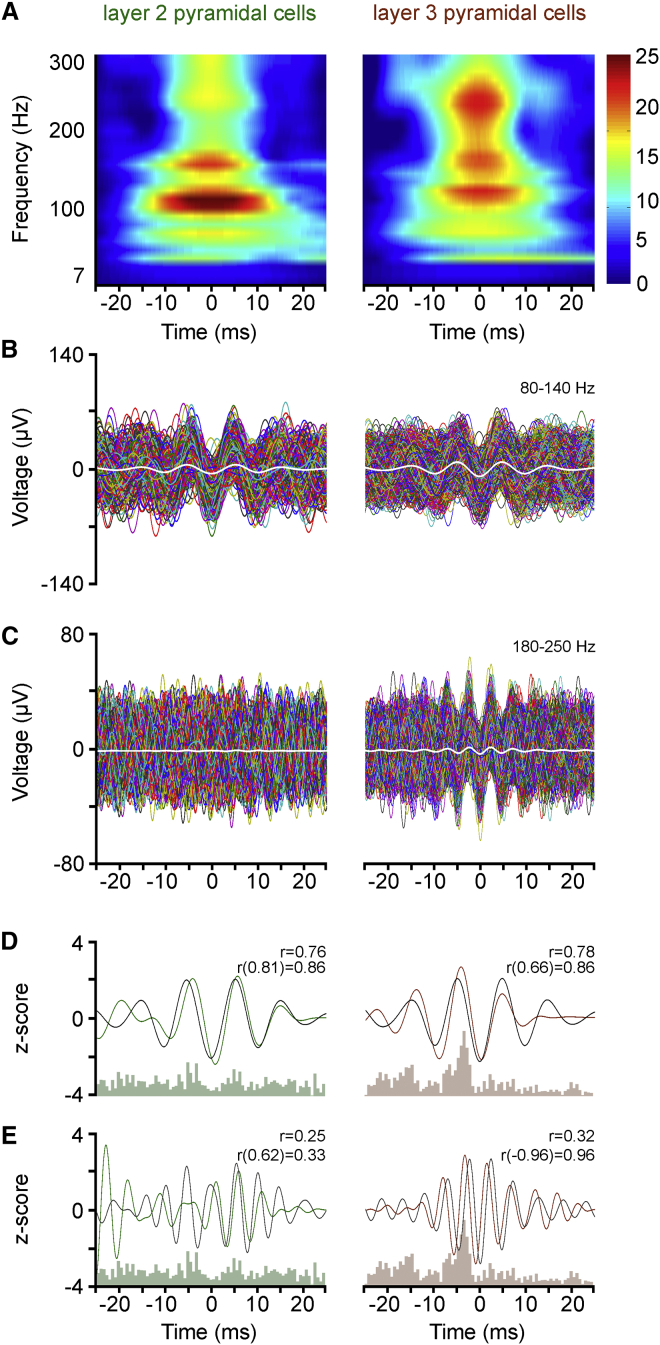
Ultra-high-frequency network events in the hippocampus are instrumental in a dialogue with the neocortex during memory formation, but the existence of transient ∼200 Hz network events in the neocortex is not clear. Our recordings from neocortical layer II/III of freely behaving rats revealed field potential events at ripple and high-gamma frequencies repeatedly occurring at troughs of spindle oscillations during sleep. Juxtacellular recordings identified subpopulations of fast-spiking, parvalbumin-containing basket cells with epochs of firing at ripple (∼200 Hz) and high-gamma (∼120 Hz) frequencies detected during spindles and centered with millisecond precision at the trough of spindle waves in phase with field potential events but phase shifted relative to pyramidal cell firing. The results suggest that basket cell subpopulations are involved in spindle-nested, high-frequency network events that hypothetically provide repeatedly occurring neocortical temporal reference states potentially involved in mnemonic processes.


Figures

Figure 1
Figure 1
Spindle Nested High-Frequency Network Events Are Centered around Spindle Troughs during SWS (A–H) Analysis of the same sleep spindle recorded simultaneously by a tungsten electrode in layer III (A–D) and a juxtacellular glass electrode placed adjacent to a layer III pyramidal cell (E–H). (A and E) Wavelet analysis of the spindle (white trace, unfiltered) showing high-gamma and ripple frequencies emerging around troughs of the spindle. (B and F) Hilbert transformation and phase-amplitude modulation at ripple (180–250 Hz, gray) and high-gamma (75–130 Hz, black) frequencies of the same spindle shown in (A) and (E). Gray bands indicate trough-to-peak halves of spindle cycles. (C and G) Phase-amplitude coupling diagrams of high-gamma (orange) and ripple (red) frequency network events, and spindle waves (trough at 0°) indicate moderate coupling. (D and H) Wavelet spectra triggered relative to spindle peaks (timed at 0 ms, top panels) and troughs (timed at 0 ms, bottom panels) show spindle-trough-centered emergence of ripple band (spindle ripple) and high-gamma (spindle high gamma) oscillations. (I) Sharp-wave ripples in the dorsal CA1 region of the hippocampus are not preferentially timed relative to simultaneously recorded neocortical spindle oscillations. Left: timing of the peak of maximal amplitude cycles in hippocampal ripples (dots) during consecutive spindles of normalized length from three animals (gray and white bands) with the average and SD of ripple probability shown on the histogram. Right: timing of hippocampal ripples (dots) during consecutive spindle troughs from three animals (gray and white bands) with the average and SD of ripple probability shown on the histogram relative to the spindle trough timed at 0 ms (bin width, 0.78 ms).
Figure 2
Figure 2
High-Frequency Contribution of Identified FS Interneurons to the Trough of Spindle Oscillations during Natural Sleep (A) Juxtacellularly recorded activity of an identified spindle ripple cell (top, wideband; middle, filtered for spindles; bottom, filtered for spikes). (B) Normalized interspike interval distribution (top left, burgundy for overall, red for spindles; inset, time course of single spikes) and autocorrelogram (bottom left, burgundy for overall, red for spindles), and firing distribution of the cell during spindles of normalized length (right). (C) Top: reconstruction of the dendritic (red) and axonal (black) arborization of the spindle ripple cell. Insets: the neurobiotin-labeled cell expressed parvalbumin and showed features of a basket cell with DAB-Ni containing axonal terminals (arrows) decorating an unlabeled soma. (D) Top left: peri-trough raster plots of firing of individual spindle ripple cells (top three panels; the top panel shows the cell presented in A–C) and average firing frequency distribution (bottom left; bin width, 0.78 ms) with three peaks of activity centered around the spindle trough shown at 0 ms determined by kernel smoothing and peak detection. Data are based on successive spindle troughs recorded in SWS. Right: cumulative circular plots of firing probability in single cycles of spindles for the three cells (trough at 0°) and their average circular plot of firing distribution (bottom) with vectors of individual cells at the perimeter. Error bars represent SEM. (E–H) Spindle high-gamma cells (E and F) and simple spindle trough cells (G and H) are presented along the same logic as spindle ripple cells in (D) and (C). Error bars in (E) and (G) represent SEM. (I) Average firing probability of all spindle-trough-related FS cells tuned to the trough (0°) of spindle cycles, including spindle ripple, spindle high-gamma, and simple spindle trough cells. Error bars represent SEM.
Figure 3
Figure 3
Contribution of FS Interneurons to the Descending Phase of Spindle Cycles (A) Juxtacellularly recorded activity of an identified spindle descending-phase cell (top, wideband; middle, filtered for spindles; bottom, filtered for spikes). (B) Interspike interval distribution (top left, dark blue for overall, light blue for spindles; inset. time course of single spikes), autocorrelogram (top right), and firing distribution of the cell during spindles of normalized length (bottom right). Bottom right: circular plot of firing probability of the cell in single cycles of spindles (trough at 0°). (C) Left: reconstructions of the dendritic (blue) and axonal (black) arborization of spindle descending-phase cells. The cell on the left is shown in (A) and (B). Insets: the neurobiotin-labeled cells expressed parvalbumin and showed features of basket cells with DAB-Ni containing axonal terminals (arrows) decorating unlabeled somata. (D) Average circular plot of firing frequency with vectors of individual cells at the perimeter (top) and firing probability distribution (middle) in single spindle cycles. Bottom: the average firing probability of all spindle descending-phase-related FS cells tuned to the descending phase of the spindle cycle with a single peak of activity determined by kernel smoothing and peak detection. Error bars represent SEM.
Figure 4
Figure 4
High-Frequency Local Field Potentials at the Trough of Spindle Oscillations Recorded Juxtacellularly around Identified FS Interneurons Are Variable (A) Average wavelet spectra constructed from spindle troughs (timed at 0 ms) during which juxtacellular spikes were absent in functional subgroups of FS cells. Both ripple band and high-gamma activity emerge around spindle troughs in recordings juxtacellular to spindle ripple cells, but activity predominantly in the high-gamma range is characteristic of recordings juxtacellular to other functional subgroups of FS cells (spindle high-gamma, simple spindle, and spindle descending-phase cells). (B and C) Consecutive individual traces filtered 80–140 Hz (B) and 180–250 Hz (C) aligned according to spindle troughs (0 ms). Colored traces show all spindle troughs without spikes available from a representative cell from each FS interneuron subgroup (same cell for B and C); averages of subgroups are shown in white. Oscillations in the high-gamma range appear in all FS subgroups, and the trough of high-gamma oscillations coincides with the spindle trough. Ripple oscillations are predominant in spindle ripple cells and the peak of ripple oscillations is at the trough of spindles. (D and E) Foreground: FS cell subgroup-dependent correlation between the firing (burgundy, orange, red, and blue; kernel-smoothed firing frequency distributions bandpass filtered at 80–140 Hz, D, and 180–250 Hz, E) and local field activity (black; z-scored averages shown in B and C) recorded juxtacellularly to FS interneurons (r, Pearson correlation coefficients). Background: average firing frequency distribution histograms of FS cell subgroups. Using the common time reference of spindle troughs, spikes were correlated with the oscillations shown in (A) and (B) recorded during spindle cycles without firing.
Figure 5
Figure 5
Differential Recruitment of Superficial Layer II and Deeper Layer III Pyramidal Cells during Spindle Troughs of Natural Sleep (A) Dendritic reconstructions of juxtacellularly recorded superficial layer II (green) and deep layer III (brown) pyramidal cells. Cells with somata at cortical depth shown in gray were excluded from the study. (B) Raster plots of firing (left) around the spindle trough (0 ms) with corresponding cumulative circular plots of firing distribution within single cycles of spindles (right) of individual layer II (n = 18) and layer III (n = 10) pyramidal cells and averages of firing frequency distributions around the spindle trough (bottom; bin width, 0.78 ms; error bars, SEM). Error bars represent SEM. (C) Average circular plots of firing distribution (right) with vectors of individual cells at the perimeter indicate that deep layer III pyramidal cells predominantly fire just before the trough, in contrast to temporally scattered vectors of superficial layer II cells. (D) Firing frequencies before and after spindle troughs were similar in layer II pyramidal cells, but dropped following the trough in deep layer III pyramidal cells (left). Error bars represent SEM.
Figure 6
Figure 6
High-Frequency Network Events at the Trough of Spindle Oscillations Recorded Juxtacellularly around Identified Pyramidal Cells (A) Average wavelet spectra constructed from spindle troughs (timed at 0 ms) during which juxtacellular spikes were absent in pyramidal cells. Both ripple band and high-gamma activity emerge around spindle troughs in recordings juxtacellular to layer III pyramidal cells, but activity predominantly in the high-gamma range is characteristic of recordings juxtacellular to layer II pyramidal cells. (B and C) Consecutive individual traces filtered 80–140 Hz (B) and 180–250 Hz (C) aligned according to spindle troughs (0 ms). Colored traces show all spindle troughs without spikes available from a representative cell from layer II and III pyramidal cells (same cell for B and C); averages of layer II and III pyramids are shown in white. Oscillations in the high-gamma range appear in both pyramidal cell populations, and the trough of high-gamma oscillations coincides with the spindle trough. Ripple oscillations are predominant in layer III pyramidal cells and the trough of ripple oscillations is at the trough of spindles. (D and E) Foreground: correlation between the firing (green and brown; kernel-smoothed firing frequency distributions bandpass filtered at 80–140 Hz, D, and 180–250 Hz, E) and network activity (black; z-scored averages shown in B and C) recorded juxtacellularly to pyramidal cells (r, Pearson correlation coefficients). Background: average firing frequency distribution histograms of pyramidal cells.

References

    1. Atallah B.V., Scanziani M. Instantaneous modulation of gamma oscillation frequency by balancing excitation with inhibition. Neuron. 2009;62:566–577. - PMC - PubMed
    1. Bacci A., Huguenard J.R. Enhancement of spike-timing precision by autaptic transmission in neocortical inhibitory interneurons. Neuron. 2006;49:119–130. - PubMed
    1. Beierlein M., Gibson J.R., Connors B.W. Two dynamically distinct inhibitory networks in layer 4 of the neocortex. J. Neurophysiol. 2003;90:2987–3000. - PubMed
    1. Born J., Rasch B., Gais S. Sleep to remember. Neuroscientist. 2006;12:410–424. - PubMed
    1. Burgalossi A., Herfst L., von Heimendahl M., Förste H., Haskic K., Schmidt M., Brecht M. Microcircuits of functionally identified neurons in the rat medial entorhinal cortex. Neuron. 2011;70:773–786. - PubMed