. 2017 Jan 15:48:499-520.
doi: 10.1016/j.actbio.2016.10.020. Epub 2016 Oct 13.

Cytocompatibility and early inflammatory response of human endothelial cells in direct culture with Mg-Zn-Sr alloys

Affiliations

Cytocompatibility and early inflammatory response of human endothelial cells in direct culture with Mg-Zn-Sr alloys

Aaron F Cipriano et al. Acta Biomater. .

Abstract

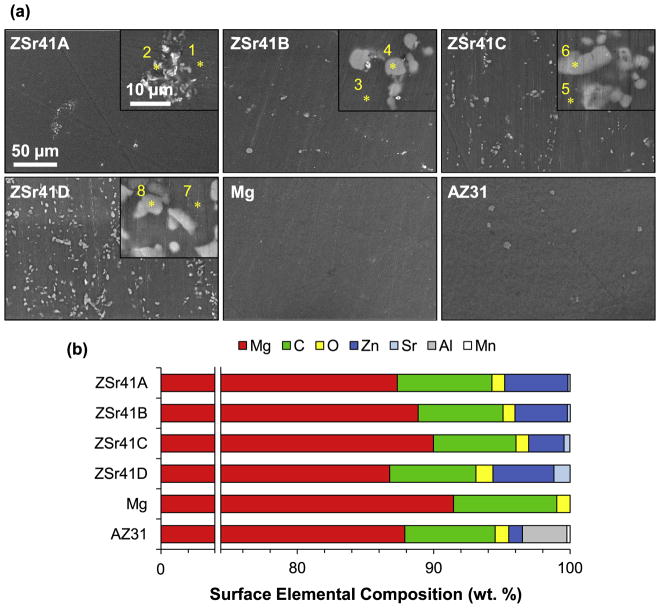
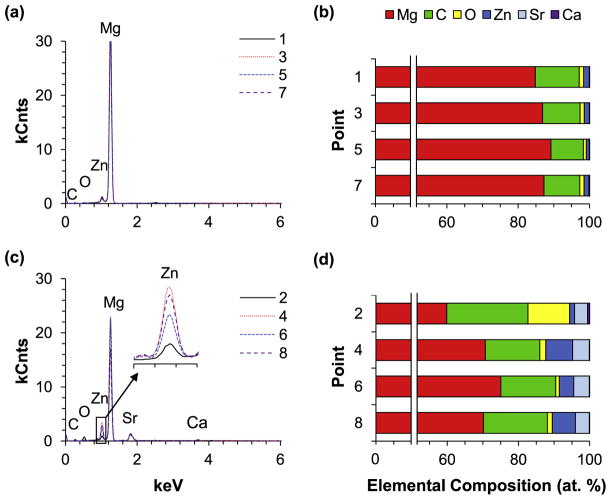
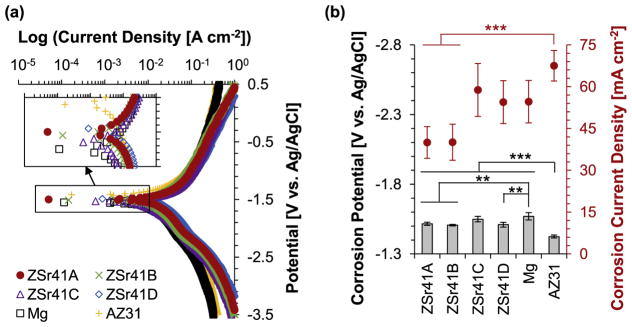
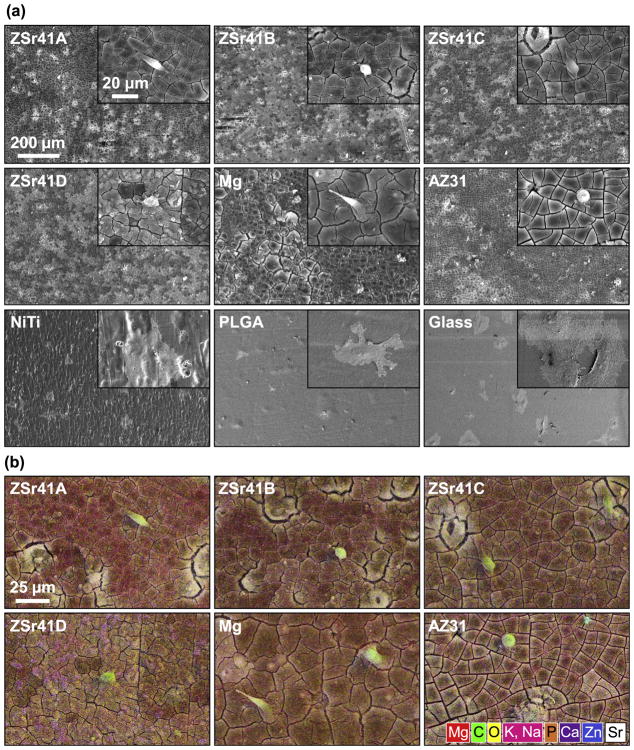
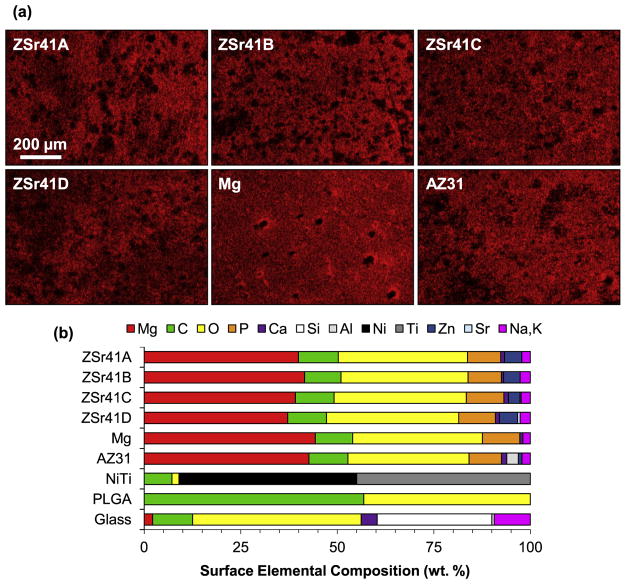
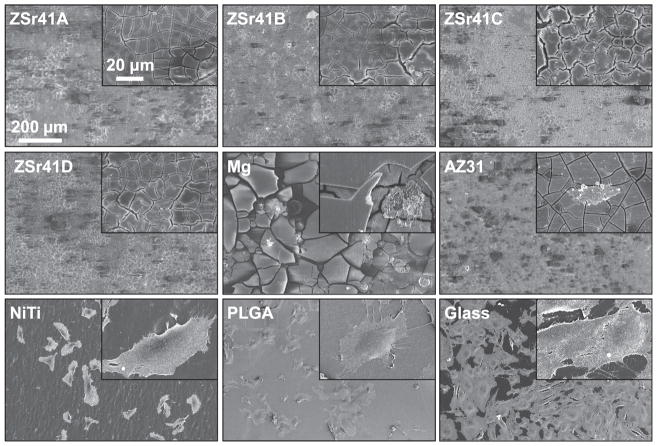
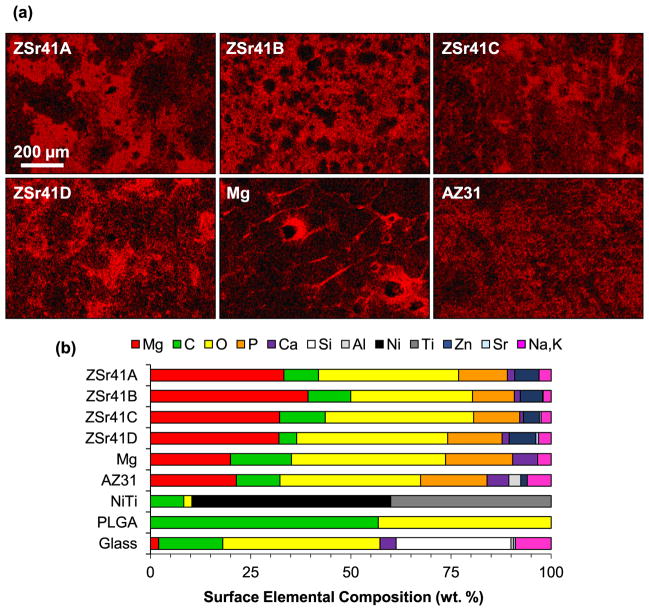
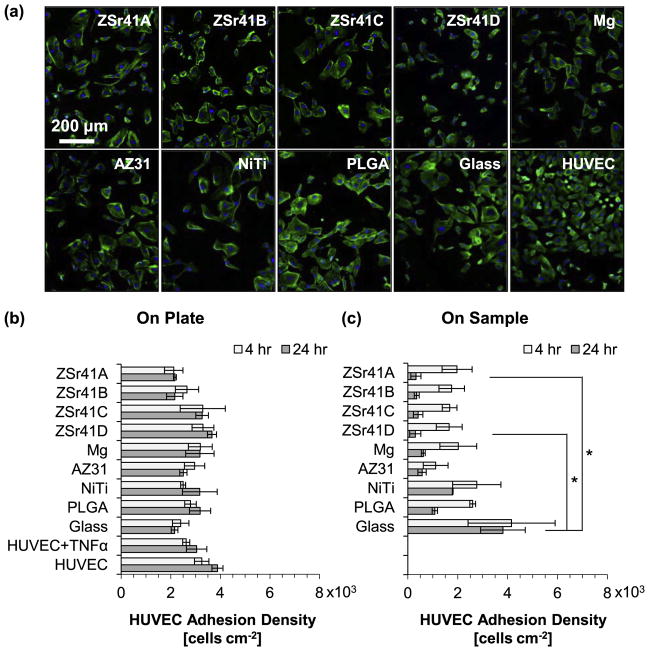
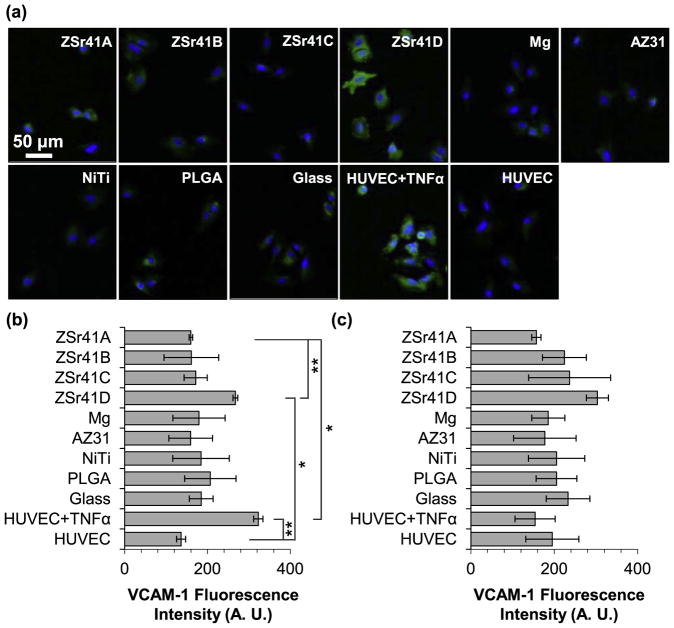
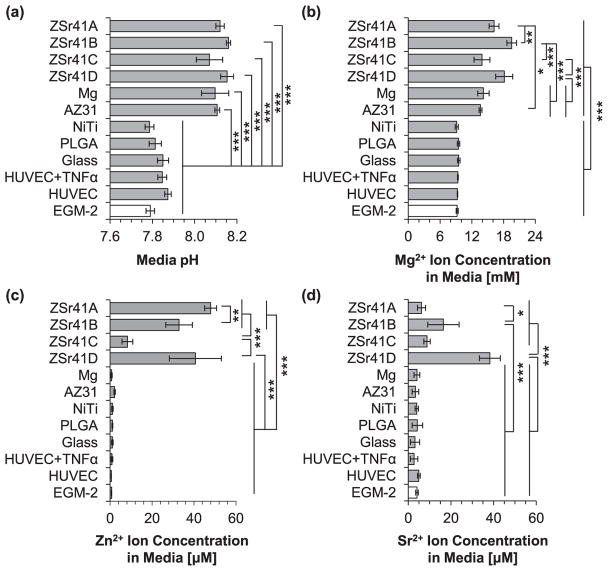
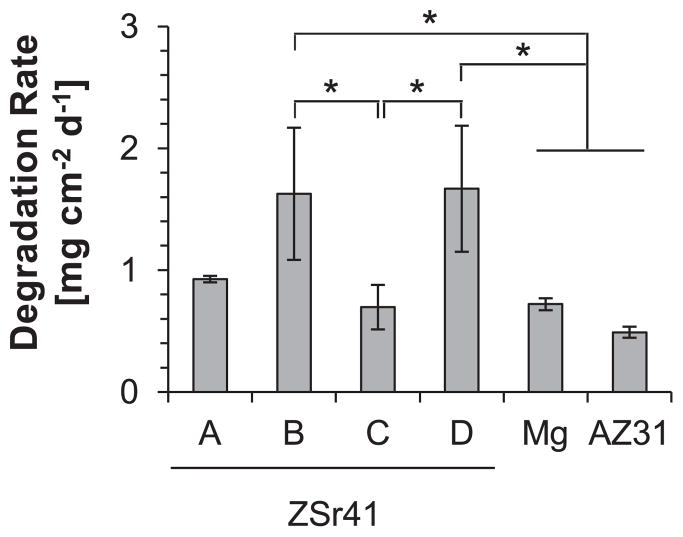
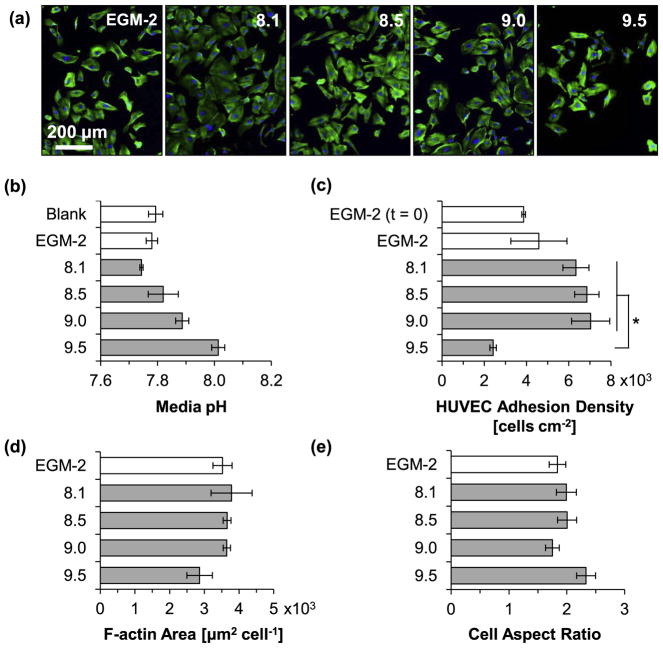
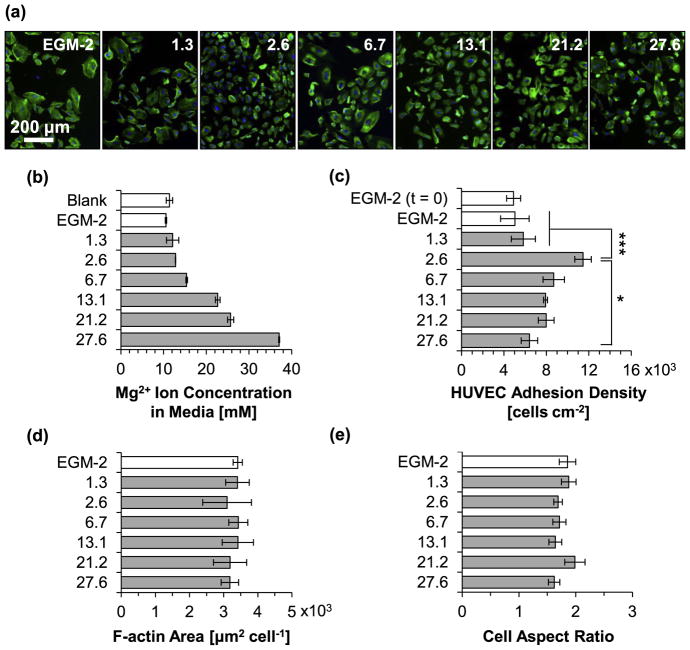
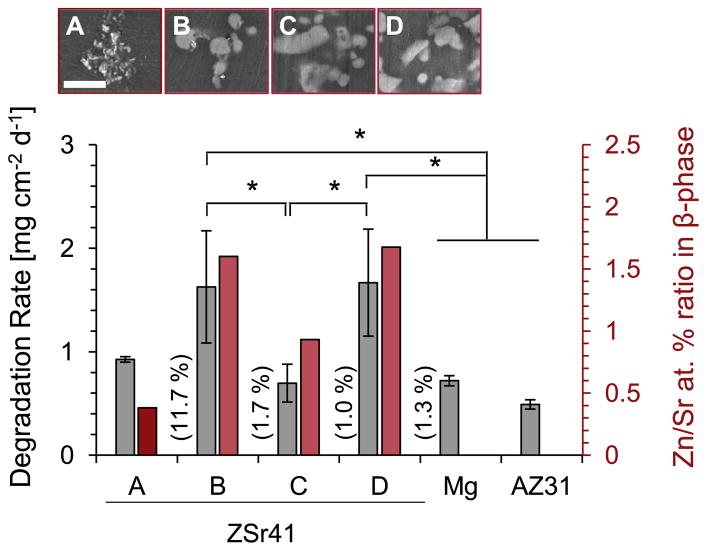
Crystalline Mg-Zinc (Zn)-Strontium (Sr) ternary alloys consist of elements naturally present in the human body and provide attractive mechanical and biodegradable properties for a variety of biomedical applications. The first objective of this study was to investigate the degradation and cytocompatibility of four Mg-4Zn-xSr alloys (x=0.15, 0.5, 1.0, 1.5wt%; designated as ZSr41A, B, C, and D respectively) in the direct culture with human umbilical vein endothelial cells (HUVEC) in vitro. The second objective was to investigate, for the first time, the early-stage inflammatory response in cultured HUVECs as indicated by the induction of vascular cellular adhesion molecule-1 (VCAM-1). The results showed that the 24-h in vitro degradation of the ZSr41 alloys containing a β-phase with a Zn/Sr at% ratio ∼1.5 was significantly faster than the ZSr41 alloys with Zn/Sr at% ∼1. Additionally, the adhesion density of HUVECs in the direct culture but not in direct contact with the ZSr41 alloys for up to 24h was not adversely affected by the degradation of the alloys. Importantly, neither culture media supplemented with up to 27.6mM Mg2+ ions nor media intentionally adjusted up to alkaline pH 9 induced any detectable adverse effects on HUVEC responses. In contrast, the significantly higher, yet non-cytotoxic, Zn2+ ion concentration from the degradation of ZSr41D alloy was likely the cause for the initially higher VCAM-1 expression on cultured HUVECs. Lastly, analysis of the HUVEC-ZSr41 interface showed near-complete absence of cell adhesion directly on the sample surface, most likely caused by either a high local alkalinity, change in surface topography, and/or surface composition. The direct culture method used in this study was proposed as a valuable tool for studying the design aspects of Zn-containing Mg-based biomaterials in vitro, in order to engineer solutions to address current shortcomings of Mg alloys for vascular device applications.

Statement of significance: Magnesium (Mg) alloys specifically designed for biodegradable implant applications have been the focus of biomedical research since the early 2000s. Physicochemical properties of Mg alloys make these metallic biomaterials excellent candidates for temporary biodegradable implants in orthopedic and cardiovascular applications. As Mg alloys continue to be investigated for biomedical applications, it is necessary to understand whether Mg-based materials or the alloying elements have the intrinsic ability to direct an immune response to improve implant integration while avoiding cell-biomaterial interactions leading to chronic inflammation and/or foreign body reactions. The present study utilized the direct culture method to investigate for the first time the in vitro transient inflammatory activation of endothelial cells induced by the degradation products of Zn-containing Mg alloys.

Keywords: Biodegradable Magnesium Zinc Strontium alloy; Biomedical implants; Early inflammatory response; Human umbilical vein endothelial cells (HUVEC); Induction of vascular cell adhesion molecule-1 (VCAM-1); Mg-Zn-Sr alloy.


Figures

Fig. 1
Fig. 1
Microstructural analyses of ZSr41 alloys. (a) SEM images of ZSr41A-D alloys, commercial pure Mg (control), and commercial AZ31 alloy (reference). Scale bar = 50 μm for all images. Original magnification: 600×. Insets in (a) are SEM images of the secondary phases respective to each alloy at a high magnification of 5000×. Scale bar = 10 μm for all insets. (b) Surface elemental composition (wt%) quantified through EDS area analysis on (a) at 600× magnification. Points 1–8 represent locations for the EDS point analyses for which results are shown in Fig. 2.
Fig. 2
Fig. 2
EDS analyses of the primary and secondary phases of ZSr41 alloys, including (a,c) EDS spectra and (b,d) quantification of elemental composition (at%). (a) and (b): EDS analyses of points 1, 3, 5, and 7 at the α-matrices of ZSr41A-D in Fig. 1a; (c) and (d): EDS analyses of points 2, 4, 6, and 8 at the intermetallic β-phases in ZSr41A-D in Fig. 1a.
Fig. 3
Fig. 3
Electrochemical testing results of ZSr41 alloys, pure Mg control, and AZ31 reference. (a) potentiodynamic polarization curves of the polished Mg-based samples at 37 °C using r-SBF as the electrolyte; and (b) corrosion potential and corrosion current density of ZSr41 alloys, pure Mg, and AZ31 obtained from Tafel extrapolation (ASTM G102-89) of potentiodynamic polarization curves; values are mean ± SD, n = 3, **p < 0.01, ***p < 0.001.
Fig. 4
Fig. 4
Human umbilical vein endothelial cells (HUVECs) in direct contact with ZSr41 alloy surface after 4 h of direct culture in EGM-2 media. (a) SEM micrographs of ZSr41 alloys, pure Mg (control), and reference materials (AZ31 alloy, NiTi, PLGA, and glass, respectively). Original magnification: 150×; scale bar = 200 μm for all images. Insets in (a) were taken at 1000× original magnification with scale bar = 20 μm for all images. (b) SEM-EDS composite image of the ZSr41 alloys, Mg control, and AZ31 reference at 1000× magnification. The color mapping in each image represents surface elemental distribution measured by EDS (red = Mg, green = C, yellow = O, pink = K, Na, orange = P, purple = Ca, blue = Zn, white = Sr). Scale bar = 25 μm for all images. (For interpretation of the references to colour in this figure legend, the reader is referred to the web version of this article.)
Fig. 5
Fig. 5
Surface characterization of Mg-based materials: (a) EDS elemental distribution map of Mg Kα1 lines of ZSr41 alloys (A–D), pure Mg (control), and AZ31 alloy (reference), respectively, after 4 h direct culture with HUVECs in EGM-2 media. Original magnification: 150×; scale bar = 200 μm for all images. (b) Surface elemental composition (wt%) based on EDS quantification on 150× images of Mg-based materials, NiTi, PLGA, and glass.
Fig. 6
Fig. 6
HUVECs in direct contact with ZSr41 alloy surface after 24 h of direct culture in EGM-2 media. SEM micrographs of ZSr41 alloys, pure Mg (control), and reference materials (AZ31 alloy, NiTi, PLGA, and glass, respectively). Original magnification: 150×; scale bar = 200 μm for all images. Insets in were taken at 1000× original magnification with scale bar = 20 μm for all images.
Fig. 7
Fig. 7
Surface characterization of Mg-based materials: (a) EDS elemental distribution map of Mg Kα1 lines of ZSr41 alloys (A–D), pure Mg (control), and AZ31 alloy (reference), respectively, after 24 h direct culture with HUVECs in EGM-2 media. Original magnification: 150×; scale bar = 200 μm for all images. (b) Surface elemental composition (wt%) based on EDS quantification on 150× images of Mg-based materials, NiTi, PLGA, and glass.
Fig. 8
Fig. 8
HUVEC adhesion after 4 and 24 h of direct culture on ZSr41 alloys (A–D), pure Mg control, reference materials (AZ31 alloy, NiTi, PLGA, and glass), cells only supplemented with 10 ng/mL TNFα, and cells only control: (a) representative fluorescence images of adhered HUVECs at 24 h on the tissue culture plates, (b) adhesion density on the culture plate surrounding each corresponding sample (indirect contact with the sample), and (c) adhesion density on the sample surface (direct contact with the sample). Values are mean ± standard error of the means, n = 3; *p < 0.05.
Fig. 9
Fig. 9
HUVEC responses after 4 and 24 h of direct culture with ZSr41 alloys (A–D), pure Mg control, reference materials (AZ31 alloy, NiTi, PLGA, and glass), cells only supplemented with 10 ng/mL TNFα (positive control), and cells only (negative control): (a) Fluorescence images of adhered HUVECs at 4 h culture. Blue color indicates DAPI stained nuclei and green color indicates FITC-labeled VCAM-1. Scale bar = 50 μm for all images. (b) Quantification of VCAM-1 mean fluorescence intensity signal per pixel at 4 h culture. (c) Quantification of VCAM-1 mean fluorescence intensity signal per pixel at 24 h culture. All results were only for cells adhered on the culture plate surrounding the samples. Values are mean ± SEM, n = 3, *p < 0.05 and **p < 0.01.
Fig. 10
Fig. 10
Analysis of solubilized degradation products in culture media after 4 h of direct culture with ZSr41 alloys (A–D), pure Mg control, reference materials (AZ31 alloy, NiTi, PLGA, and glass), cells only supplemented with 10 ng/mL TNFα, cells only, and blank EGM-2 media: (a) pH of media, (b) Mg2+ ion concentration, (c) Zn2+ ion concentration, and (d) Sr2+ ion concentration. Values are mean ± SD, n = 3. *p < 0.05, **p < 0.01, ***p < 0.001.
Fig. 11
Fig. 11
Analysis of solubilized degradation products in culture media after 24 h of direct culture with ZSr41 alloys (A–D), pure Mg control, reference materials (AZ31 alloy, NiTi, PLGA, and glass), cells only supplemented with 10 ng/mL TNFα, cells only, and blank EGM-2 media: (a) pH of media, (b) Mg2+ ion concentration, (c) Zn2+ ion concentration, and (d) Sr2+ ion concentration. Values are mean ± SD, n = 3. *p < 0.05, **p < 0.01, ***p < 0.001.
Fig. 12
Fig. 12
Average daily degradation rate (mass loss rate) per unit surface area of ZSr41 alloys, pure Mg control, and AZ31 reference in EGM-2 culture media during 24 h of incubation. Values are mean ± SD, n = 3; *p < 0.05.
Fig. 13
Fig. 13
HUVEC behaviors after 24 h of incubation in complete EGM-2 media with initial pH values intentionally adjusted to 8.1–9.5. (a) Fluorescence images of HUVECs. Blue color indicates DAPI stained nuclei and green color indicates Alexa Fluor® 488 stained F-actin (cytoskeleton). Scale bar = 200 μm for all images. Original magnification: 10×. (b) Measured pH of culture media after 24 h incubation with HUVECs. Blank indicates media without cells. EGM-2 indicates non-adjusted media. (c) HUVEC adhesion density on culture plates. EGM-2 (t = 0) represents HUVEC adhesion density after 24 h pre-incubation for cell stabilization prior to incubation with the alkaline media. (d) F-actin area per adhered HUVEC nucleus. (e) Cell diameter aspect ratio (Dmax/Dmin). Values in (b) are mean ± SD, and (c) – (e) are mean ± standard error of the means; n = 3 for all measurements; *p < 0.05.
Fig. 14
Fig. 14
HUVEC behaviors after 24 h of incubation in complete EGM-2 media supplemented with Mg2+ concentration of 0–27.6 mM initially. (a) Fluorescence images of HUVECs. Blue color indicates DAPI stained nuclei and green color indicates Alexa Fluor® 488 stained F-actin (cytoskeleton). Scale bar = 200 μm for all images. Original magnification: 10×. (b) Measured Mg2+ ion concentration in culture media after 24 h of incubation with HUVECs. Blank indicates media without cells. EGM-2 indicates non-adjusted media. (c) HUVEC adhesion density on culture plates. EGM-2 (t = 0) represents HUVEC adhesion density after 24 h pre-incubation for cell stabilization prior to incubation with the adjusted media. (d) F-actin area per adhered HUVEC nucleus. (e) Cell diameter aspect ratio (Dmax/Dmin). Values in (b) are mean ± SD, and (c) – (e) are mean ± standard error of the means; n = 3 for all measurements; *p < 0.05, ***p < 0.001.
Fig. 15
Fig. 15
Summary of the average daily degradation rate (mass loss rate) per unit surface area in EGM-2 media of the Mg-based materials in this study and critical Zn/Sr at% ratios that affect β-phase formation and corrosion resistance of ZSr41 alloys. Scale bar in SEM micrographs = 10 μm. Numbers in parenthesis indicate elemental O content (at%) in the β-phase of each ZSr41 alloy. Degradation values are mean ± SD, n = 3; *p < 0.05.

References

    1. Staiger MP, Pietak AM, Huadmai J, Dias G. Magnesium and its alloys as orthopedic biomaterials: a review. Biomaterials. 2006;27(9):1728–1734. - PubMed
    1. Witte F, Hort N, Vogt C, Cohen S, Kainer KU, Willumeit R, Feyerabend F. Degradable biomaterials based on magnesium corrosion. Curr Opin Solid State Mater Sci. 2008;12(5–6):63–72.
    1. Zheng YF, Gu XN, Witte F. Biodegradable metals. Mater Sci Eng. 2014;77:1–34.
    1. Hermawan H, Dubé D, Mantovani D. Developments in metallic biodegradable stents. Acta Biomater. 2010;6(5):1693–1697. - PubMed
    1. Amini AR, Wallace JS, Nukavarapu SP. Short-term and long-term effects of orthopedic biodegradable implants. J Long Term Eff Med Implants. 2011;21(2):93–122. - PMC - PubMed

Publication types