

Multisite reliability of MR-based functional connectivity
- PMID: 27746386
- PMCID: PMC5322153
- DOI: 10.1016/j.neuroimage.2016.10.020
Multisite reliability of MR-based functional connectivity
Abstract
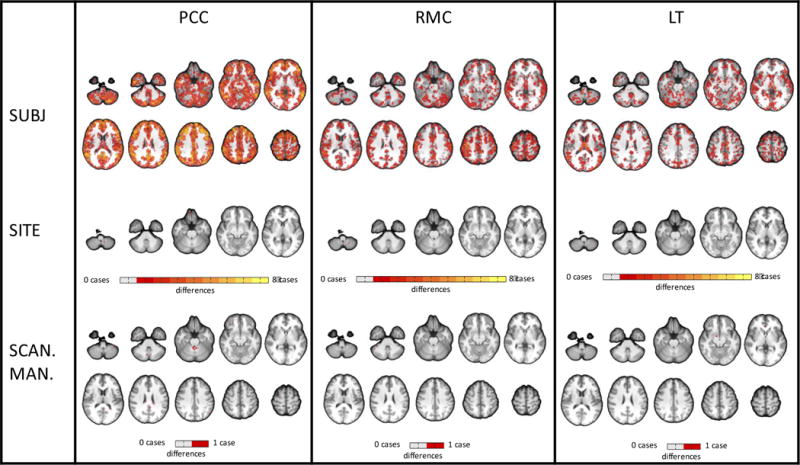
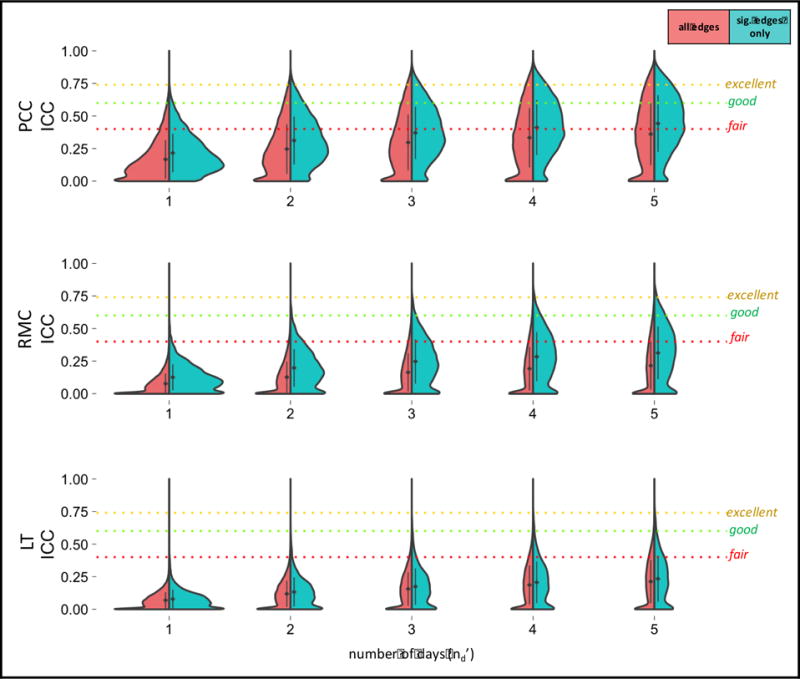
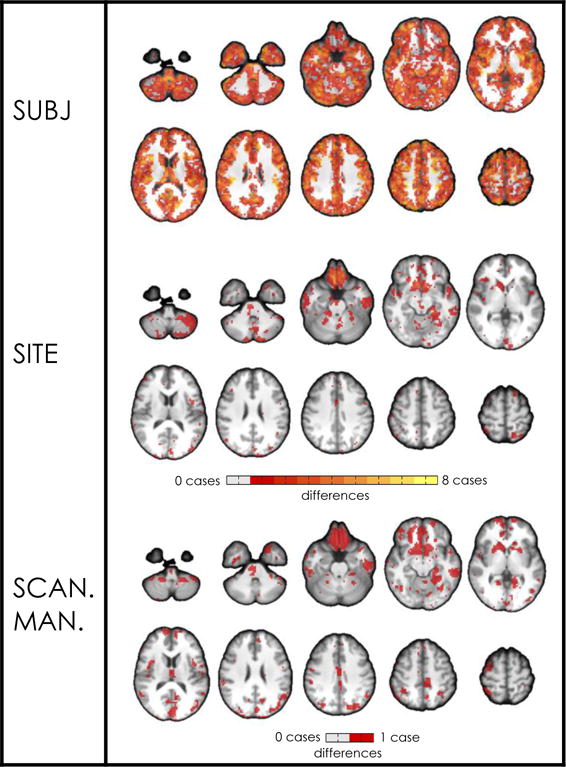
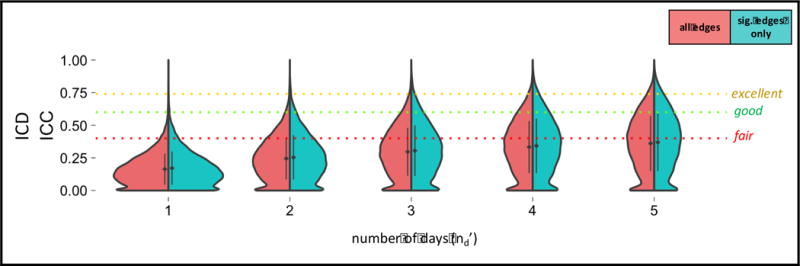
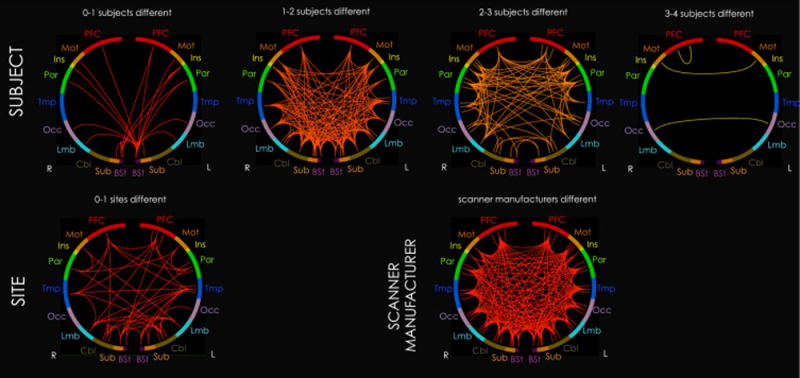
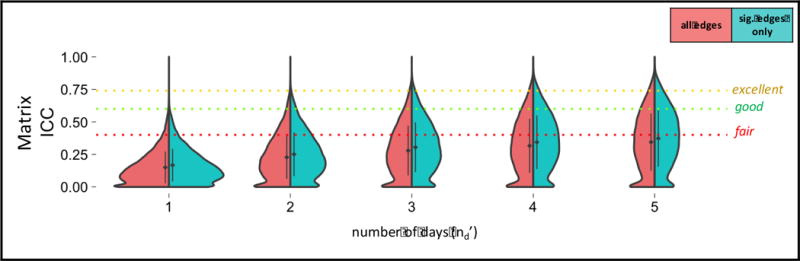
Recent years have witnessed an increasing number of multisite MRI functional connectivity (fcMRI) studies. While multisite studies provide an efficient way to accelerate data collection and increase sample sizes, especially for rare clinical populations, any effects of site or MRI scanner could ultimately limit power and weaken results. Little data exists on the stability of functional connectivity measurements across sites and sessions. In this study, we assess the influence of site and session on resting state functional connectivity measurements in a healthy cohort of traveling subjects (8 subjects scanned twice at each of 8 sites) scanned as part of the North American Prodrome Longitudinal Study (NAPLS). Reliability was investigated in three types of connectivity analyses: (1) seed-based connectivity with posterior cingulate cortex (PCC), right motor cortex (RMC), and left thalamus (LT) as seeds; (2) the intrinsic connectivity distribution (ICD), a voxel-wise connectivity measure; and (3) matrix connectivity, a whole-brain, atlas-based approach to assessing connectivity between nodes. Contributions to variability in connectivity due to subject, site, and day-of-scan were quantified and used to assess between-session (test-retest) reliability in accordance with Generalizability Theory. Overall, no major site, scanner manufacturer, or day-of-scan effects were found for the univariate connectivity analyses; instead, subject effects dominated relative to the other measured factors. However, summaries of voxel-wise connectivity were found to be sensitive to site and scanner manufacturer effects. For all connectivity measures, although subject variance was three times the site variance, the residual represented 60-80% of the variance, indicating that connectivity differed greatly from scan to scan independent of any of the measured factors (i.e., subject, site, and day-of-scan). Thus, for a single 5min scan, reliability across connectivity measures was poor (ICC=0.07-0.17), but increased with increasing scan duration (ICC=0.21-0.36 at 25min). The limited effects of site and scanner manufacturer support the use of multisite studies, such as NAPLS, as a viable means of collecting data on rare populations and increasing power in univariate functional connectivity studies. However, the results indicate that aggregation of fcMRI data across longer scan durations is necessary to increase the reliability of connectivity estimates at the single-subject level.
Copyright © 2016 The Authors. Published by Elsevier Inc. All rights reserved.
Figures
References
-
- Allen EA, Erhardt EB, Damaraju E, Gruner W, Segall JM, Silva RF, Havlicek M, Rachakonda S, Fries J, Kalyanam R, Michael AM, Caprihan A, Turner JA, Eichele T, Adelsheim S, Bryan AD, Bustillo J, Clark VP, Feldstein Ewing SW, Filbey F, Ford CC, Hutchison K, Jung RE, Kiehl KA, Kodituwakku P, Komesu YM, Mayer AR, Pearlson GD, Phillips JP, Sadek JR, Stevens M, Teuscher U, Thoma RJ, Calhoun VD. A baseline for the multivariate comparison of resting-state networks. Front Syst Neurosci. 2011;5:2. - PMC - PubMed
-
- Andellini M, Cannata V, Gazzellini S, Bernardi B, Napolitano A. Test-retest reliability of graph metrics of resting state MRI functional brain networks: A review. J Neurosci Methods. 2015;253:183–192. - PubMed
-
- Bennett CM, Miller MB. How reliable are the results from functional magnetic resonance imaging? Annals of the New York Academy of Sciences. 2010;1191:133–155. - PubMed
Publication types
MeSH terms
Grants and funding
- U01 MH082022/MH/NIMH NIH HHS/United States
- U01 MH081984/MH/NIMH NIH HHS/United States
- UL1 TR001863/TR/NCATS NIH HHS/United States
- U01 MH081902/MH/NIMH NIH HHS/United States
- U01 MH081988/MH/NIMH NIH HHS/United States
- U54 HD079124/HD/NICHD NIH HHS/United States
- U01 MH076989/MH/NIMH NIH HHS/United States
- U01 MH066160/MH/NIMH NIH HHS/United States
- K01 MH099431/MH/NIMH NIH HHS/United States
- U01 MH081928/MH/NIMH NIH HHS/United States
- U01 MH081857/MH/NIMH NIH HHS/United States
- U01 MH082004/MH/NIMH NIH HHS/United States
LinkOut - more resources
Full Text Sources
Other Literature Sources
Medical
