. 2016 Sep;9(9):209-219.
doi: 10.4172/jpb.1000408. Epub 2016 Sep 12.

The Brain Proteome of the Ubiquitin Ligase Peli1 Knock-Out Mouse during Experimental Autoimmune Encephalomyelitis

Affiliations

The Brain Proteome of the Ubiquitin Ligase Peli1 Knock-Out Mouse during Experimental Autoimmune Encephalomyelitis

Ragnhild Reehorst Lereim et al. J Proteomics Bioinform. 2016 Sep.

Abstract

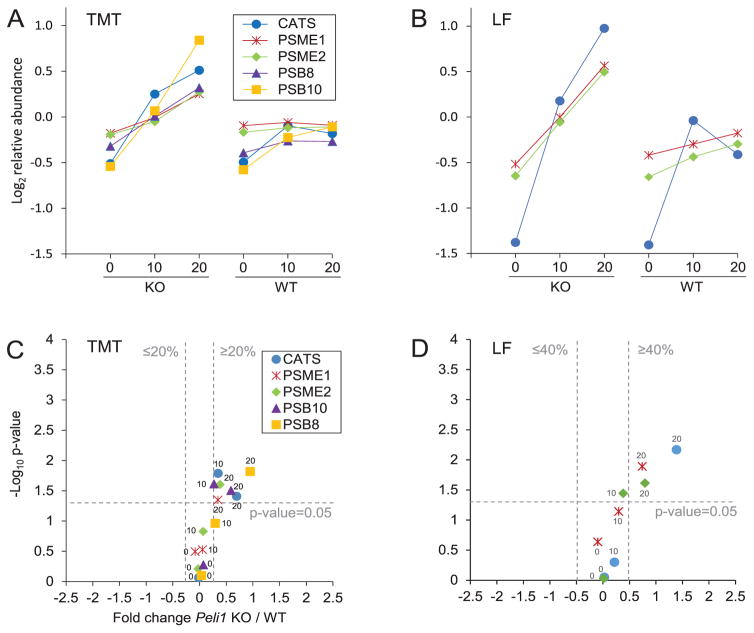
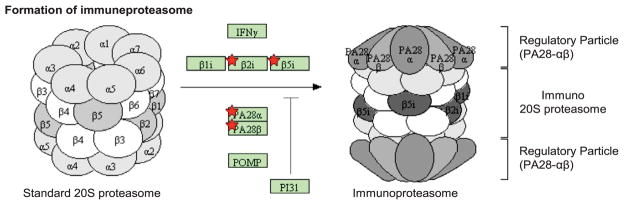
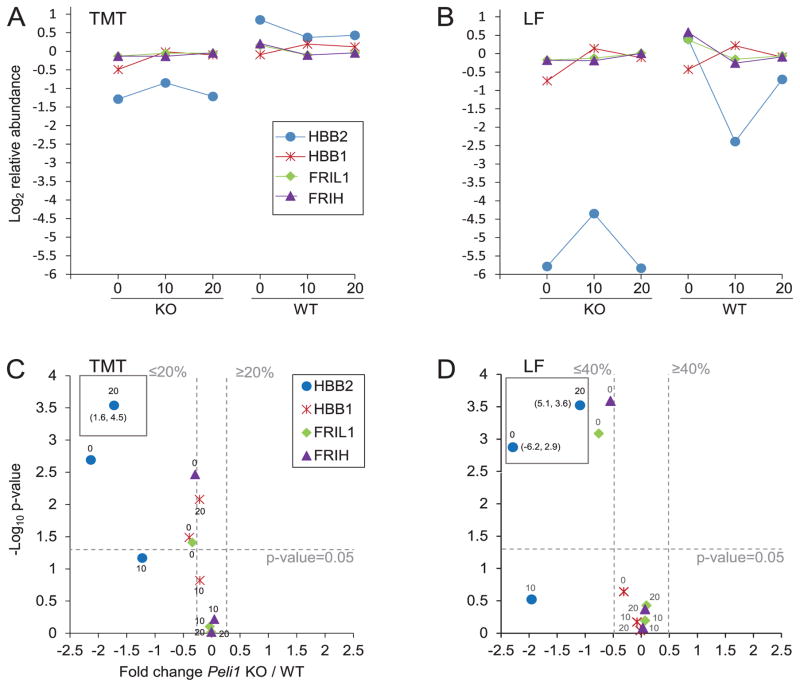
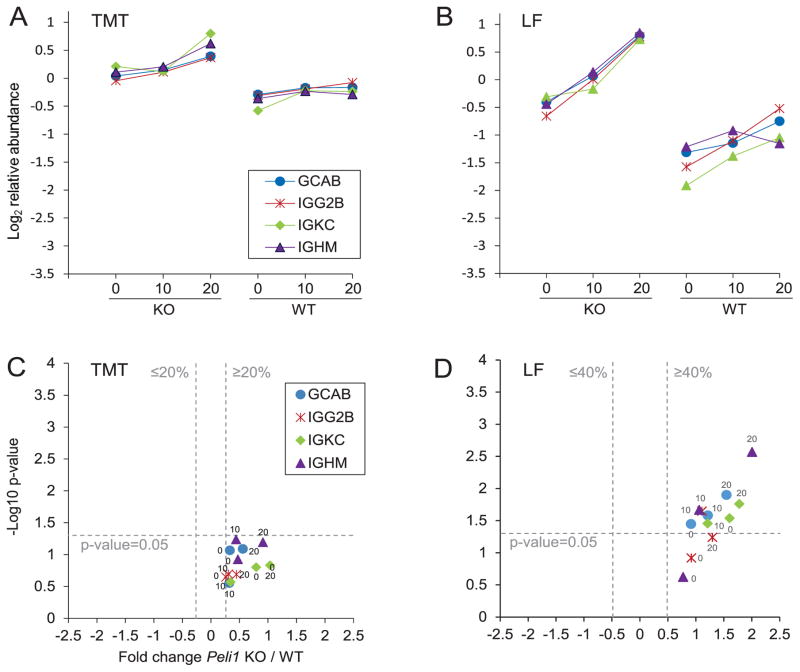
The ubiquitin ligase Peli1 has previously been suggested as a potential treatment target in multiple sclerosis. In the multiple sclerosis disease model, experimental autoimmune encephalomyelitis, Peli1 knock-out led to less activated microglia and less inflammation in the central nervous system. Despite being important in microglia, Peli1 expression has also been detected in glial and neuronal cells. In the present study the overall brain proteomes of Peli1 knock-out mice and wild-type mice were compared prior to experimental autoimmune encephalomyelitis induction, at onset of the disease and at disease peak. Brain samples from the frontal hemisphere, peripheral from the extensive inflammatory foci, were analyzed using TMT-labeling of sample pools, and the discovered proteins were verified in individual mice using label-free proteomics. The greatest proteomic differences between Peli1 knock-out and wild-type mice were observed at the disease peak. In Peli1 knock-out a higher degree of antigen presentation, increased activity of adaptive and innate immune cells and alterations to proteins involved in iron metabolism were observed during experimental autoimmune encephalomyelitis. These results unravel global effects to the brain proteome when abrogating Peli1 expression, underlining the importance of Peli1 as a regulator of the immune response also peripheral to inflammatory foci during experimental autoimmune encephalomyelitis. The proteomics data is available in PRIDE with accession PXD003710.

Keywords: Brain; Experimental autoimmune encephalomyelitis (EAE); Label-free proteomics; Multiple sclerosis; Peli1 knock-out; TMT-labeling proteomics.


Figures

Figure 1
Figure 1. Proteins quantified in brain samples from Peli1 KO and WT mice
The number of proteins quantified in both experiments with ≥3 PSMs in both of the TMT experiments and >1 unique peptide in the LF experiment. Proteins identified in protein groups were excluded.
Figure 2
Figure 2. Comparisons of regulated proteins between Peli1 KO and WT and between timepoints
The number of proteins significantly regulated between conditions (p ≤ 0.05, TMT log2 Fold change (FC) ≥ 0.263, ≤ −0.263, LF log2 FC ≥ 0.485, ≤ −0.485) and their regulation are indicated by arrows. Horizontal arrows: proteins significantly regulated between the given timepoints in KO or in WT, respectively. Large vertical arrows: number of proteins significantly regulated between KO and WT at the given timepoints. Arrowheads indicate the nominator in FC calculations. The figure should be read as follows; between KO 0 and KO 10 a total of 31 proteins were significantly different and all were more abundant in KO 10 as indicated by the arrow pointing upwards. KO 0: Peli1 knock out prior to EAE immunization, KO 10: Peli1 knock out 10 days after EAE immunization, KO 20: Peli1 knock out 20 days after EAE immunization, WT 0: Wild-type before EAE immunization, WT 10: Wild-type 10 days after EAE immunization, WT 20: Wild type 20 days after EAE immunization.
Figure 3
Figure 3. Complement proteins C1QA-C and CO4b were more abundant in Peli1 KO 20 compared to WT 20
The proteins are represented by their protein short names; complement C1q subcomponent A-C (C1QA-C), complement C-4B (CO4B). The legend and y-axis title in figure A is also valid for B, and in C is also valid for D. A) The figure shows the average protein abundance in the TMT experiment for the indicated protein after 0, 10 and 20 dpi for KO and WT, respectively. N=3 pools each condition. B) The figure shows the average protein abundance in the LF experiment after 0, 10 and 20 dpi for KO and WT, respectively. N=5–7 individual animals each condition. C) The indicated protein the average TMT fold change (FC) value and the t-test p-value at timepoint 0 (KO 0/WT 0) have been plotted in a volcano plot and indicated with “0”, at timepoint 10 dpi (KO 10/WT 10) with “10” and at timepoint 20 dpi (KO 20/WT 20) with “20”. Stapled grey lines indicate the significance thresholds for the TMT experiment (p ≤ 0.05, log2 FC KO/WT ≥ 0.263, ≤ −0.263), such that significant regulations will distribute in the upper left area (downregulated) and upper right area (upregulated) in the plot. D) Same as in C but for the LF experiment, and the stapled grey lines indicate the significance thresholds for the LF experiment (p ≤ 0.05, log2 FC ≥ 0.485, ≤ −0.485). Note that C1QB was quantified as the leading protein of a protein group in the LF experiment. The average abundances and SD for each of the regulated proteins are available in Supplementary Table 5.
Figure 4
Figure 4. The integrins ITAM and ITB2, and astrocyte associated proteins GFAP and VIME were more abundant in Peli1 KO 20 compared to WT 20
The proteins are represented by their protein short names; integrin alpha-M (ITAM), integrin beta-2 (ITB2), glial fibrillary acidic protein (GFAP), vimentin (VIME). See Figure 3 for a detailed figure legend. The figure shows the average protein abundance in KO and WT, respectively, in the TMT experiment (A) and in the LF experiment (B). Volcano plots of KO/WT protein ratios at different timepoints in the TMT experiment (C) and in the LF experiment (D) are shown. Note that ITAM and ITB2 were not detected in the LF experiment. The average abundances and SD for each of the regulated proteins are available in Supplementary Table 5.
Figure 5
Figure 5. Proteins linked to antigen presentation were more abundant in Peli1 KO 20 than WT 20
The proteins are represented by their protein short names; cathepsin S (CATS), proteasome activator complex subunit 1 (PSME1), proteasome activator complex subunit 2 (PSME2), proteasome subunit beta-10 (PSB10), proteasome subunit beta-8 (PSB8). See Figure 3 for a detailed figure legend. The figure shows the average protein abundance in KO and WT, respectively, in the TMT experiment (A) and in the LF experiment (B). Volcano plots of KO/WT protein ratios at different timepoints in the TMT experiment (C) and in the LF experiment (D) are shown. Note that PSB8 and PSB10 were not detected in the LF experiment. The average abundances and SD for each of the regulated proteins are available in Supplementary Table 5.
Figure 6
Figure 6. Proteins upregulated in Peli1 KO 20 in immunoproteasome formation
An overlay of the proteins significantly different between KO 20 and WT 20 in the TMT experiment mapped to the ≪proteasome≫ pathway in KEGG (DAVID, Benjamini Hochberg q-value=0.016). Gene products from the TMT dataset are shown with red stars. PA28a (PSME1), PA28b (PSME2), b2i (PSMB10) and b5i (PSMB8).
Figure 7
Figure 7. Iron associated proteins were less abundant in Peli1 KO 0 than WT 0
Proteins are represented by their short names; Hemoglobin subunit beta-2 (HBB2), Hemoglobin subunit beta-1 (HBB1), Ferritin light chain (FRIL1), Ferritin heavy chain (FRIH). See Figure 3 for a detailed figure legend. The figure shows the average protein abundance in KO and WT, respectively, in the TMT experiment (A) and in the LF experiment (B). Volcano plots of KO/WT protein ratios at different timepoints in the TMT experiment (C) and in the LF experiment (D) are shown. The average abundances and SD for each of the regulated proteins are available in Supplementary Table 5.
Figure 8
Figure 8. Immunoglobulins were more abundant in LF when comparing Peli1 KO 20 dpi to WT 20 dpi
The proteins are represented by their protein short names; Ig gamma-2A chain C region secreted form (GCAB), Ig gamma-2B chain C region (IGG2B), Ig kappa chain C region (IGKC), Ig mu chain C region (IGHM). See Figure 3 for a detailed figure legend. The figure shows the average protein abundance in KO and WT, respectively, in the TMT experiment (A) and in the LF experiment (B). Volcano plots of KO/WT protein ratios at different timepoints in the TMT experiment (C) and in the LF experiment (D) are shown. The average abundances and SD for each of the regulated proteins are available in Supplementary Table 5.

Similar articles

Cited by

References

    1. Weinshenker BG. Epidemiology of multiple sclerosis. Neurol Clin. 1996;14:291–308. - PubMed
    1. Beeson PB. Age and sex associations of 40 autoimmune diseases. Am J Med. 1994;96:457–462. - PubMed
    1. Harris VK, Sadiq SA. Disease biomarkers in multiple sclerosis: potential for use in therapeutic decision making. Mol Diagn Ther. 2009;13:225–244. - PubMed
    1. Compston A, Coles A. Multiple sclerosis. Lancet. 2008;372:1502–1517. - PubMed
    1. Storch MK, Stefferl A, Brehm U, Weissert R, Wallström E, et al. Autoimmunity to myelin oligodendrocyte glycoprotein in rats mimics the spectrum of multiple sclerosis pathology. Brain Pathol. 1998;8:681–694. - PMC - PubMed

LinkOut - more resources