

Ginsenoside Rb1 and compound K improve insulin signaling and inhibit ER stress-associated NLRP3 inflammasome activation in adipose tissue
- PMID: 27746687
- PMCID: PMC5052408
- DOI: 10.1016/j.jgr.2015.11.002
Ginsenoside Rb1 and compound K improve insulin signaling and inhibit ER stress-associated NLRP3 inflammasome activation in adipose tissue
Abstract
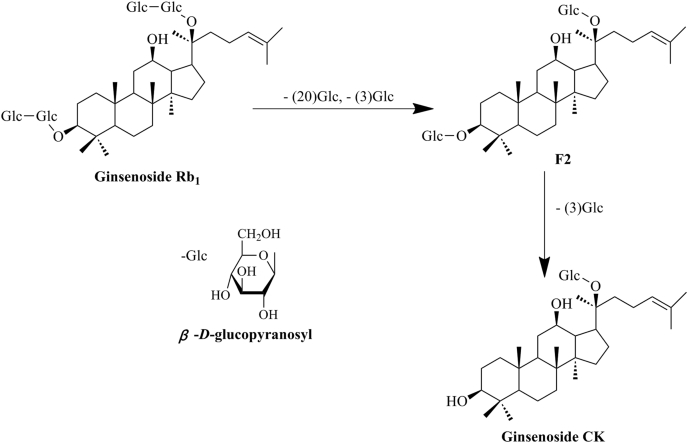
Background: This study was designed to investigate whether ginsenoside Rb1 (Rb1) and compound K (CK) ameliorated insulin resistance by suppressing endoplasmic reticulum (ER) stress-induced inflammation in adipose tissue.
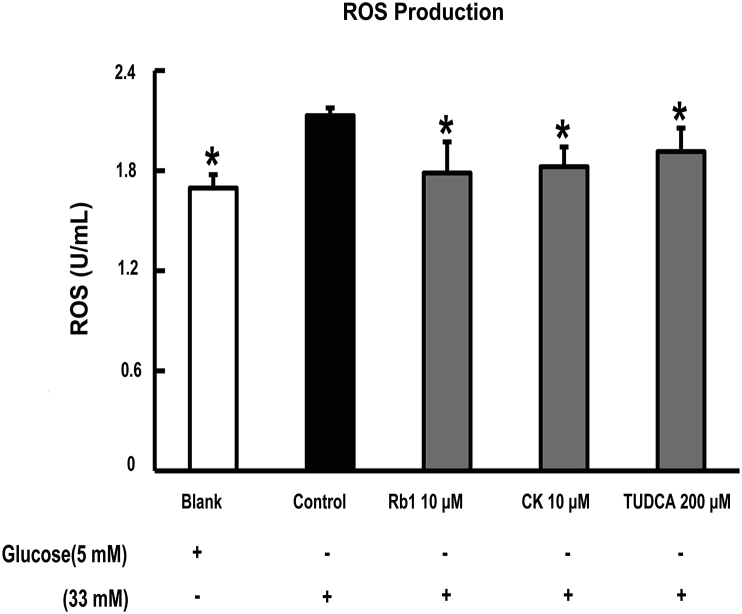
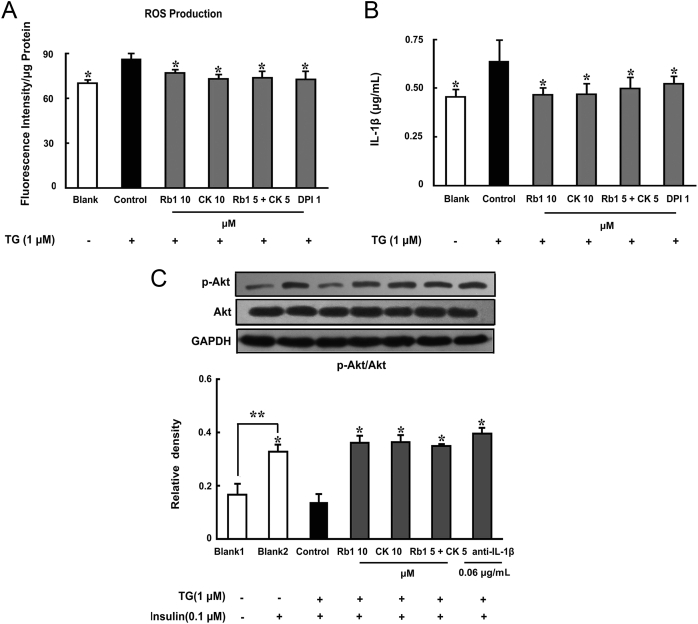
Methods: To induce ER stress, epididymal adipose tissue from mice or differentiated 3T3 adipocytes were exposed to high glucose. The effects of Rb1 and CK on reactive oxygen species production, ER stress, TXNIP/NLRP3 inflammasome activation, inflammation, insulin signaling activation, and glucose uptake were detected by western blot, emzyme-linked immunosorbent assay, or fluorometry.
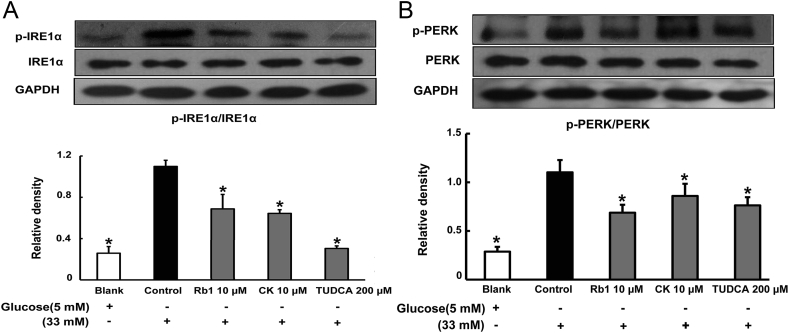
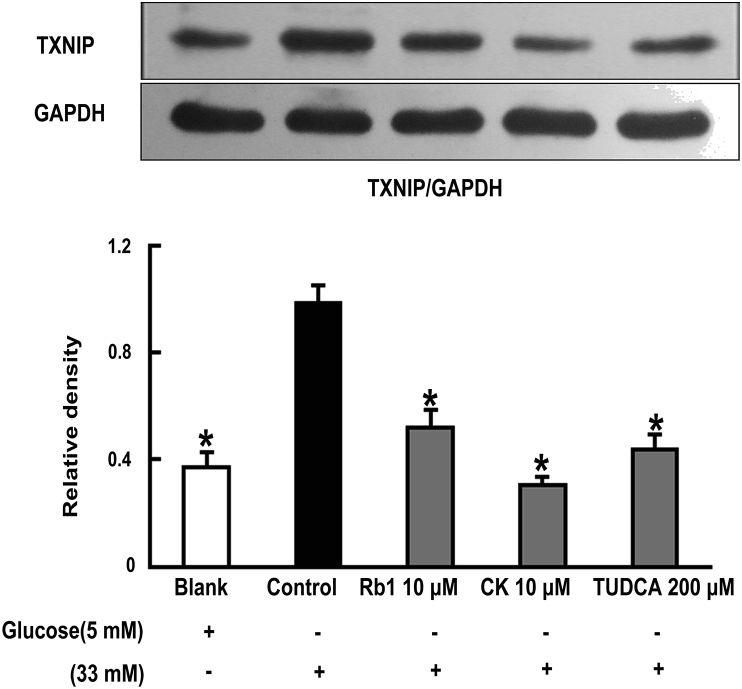
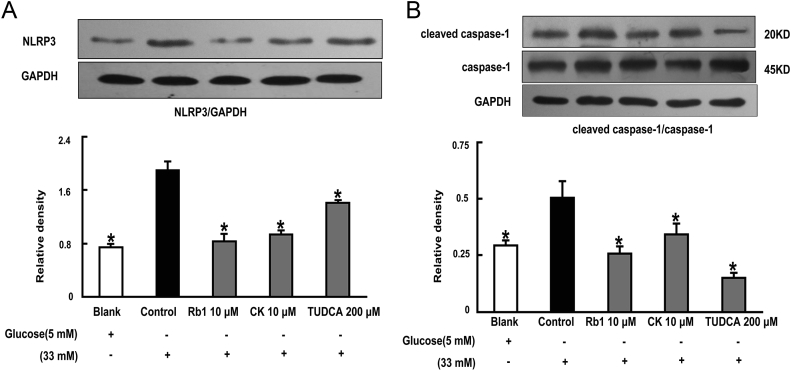
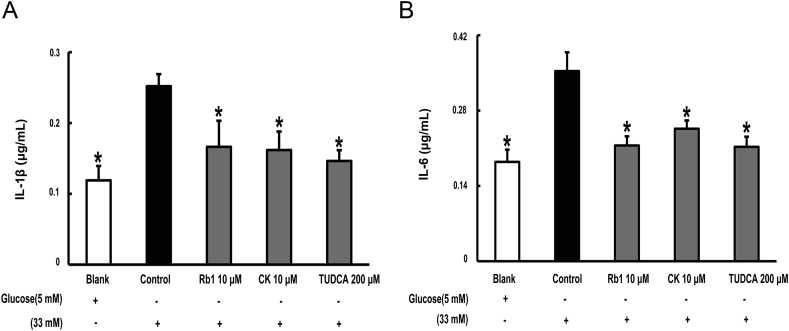
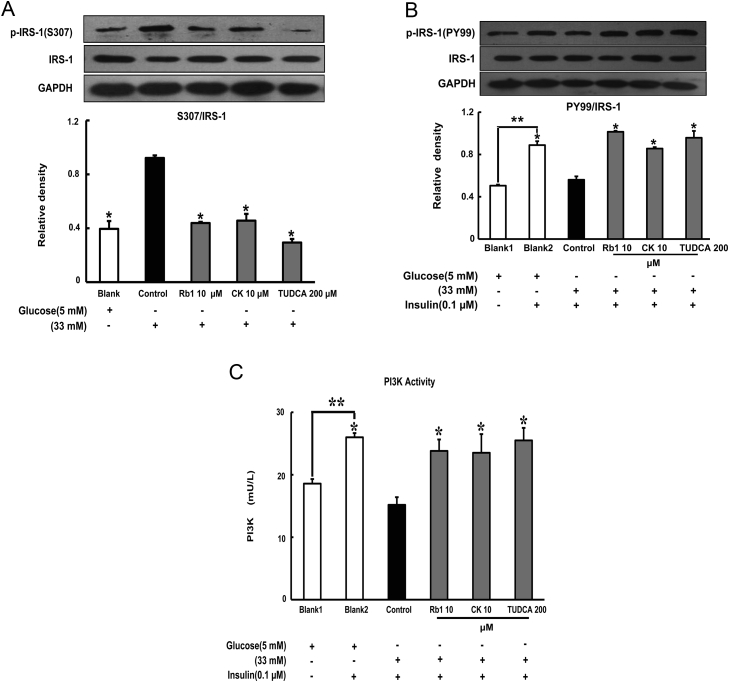
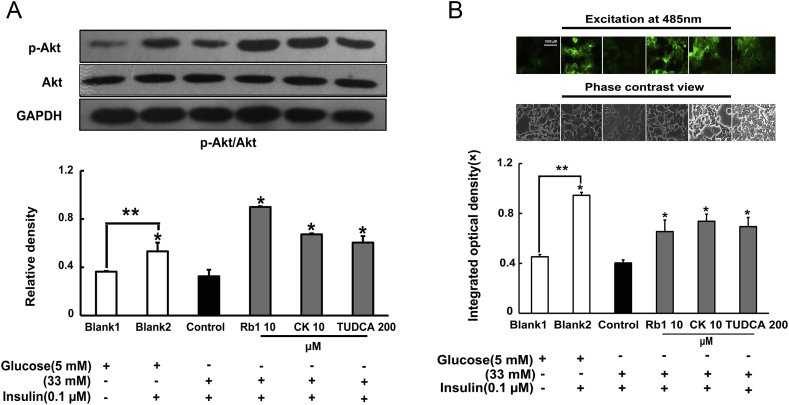
Results: Rb1 and CK suppressed ER stress by dephosphorylation of IRE1α and PERK, thereby reducing TXNIP-associated NLRP3 inflammasome activation in adipose tissue. As a result, Rb1 and CK inhibited IL-1β maturation and downstream inflammatory factor IL-6 secretion. Inflammatory molecules induced insulin resistance by upregulating phosphorylation of insulin receptor substrate-1 at serine residues and impairing insulin PI3K/Akt signaling, leading to decreased glucose uptake by adipocytes. Rb1 and CK reversed these changes by inhibiting ER stress-induced inflammation and ameliorating insulin resistance, thereby improving the insulin IRS-1/PI3K/Akt-signaling pathway in adipose tissue.
Conclusion: Rb1 and CK inhibited inflammation and improved insulin signaling in adipose tissue by suppressing ER stress-associated NLRP3 inflammation activation. These findings offered novel insight into the mechanism by which Rb1 and CK ameliorate insulin resistance in adipose tissue.
Keywords: NLRP3 inflammasome; compound k; endoplasmic reticulum stress; ginsenoside Rb1; insulin resistance.
Figures
Similar articles
-
Metformin and resveratrol inhibit Drp1-mediated mitochondrial fission and prevent ER stress-associated NLRP3 inflammasome activation in the adipose tissue of diabetic mice.Mol Cell Endocrinol. 2016 Oct 15;434:36-47. doi: 10.1016/j.mce.2016.06.008. Epub 2016 Jun 6. Mol Cell Endocrinol. 2016. PMID: 27276511
-
Effects of compound K, a metabolite of ginsenosides, on memory and cognitive dysfunction in db/db mice involve the inhibition of ER stress and the NLRP3 inflammasome pathway.Food Funct. 2020 May 1;11(5):4416-4427. doi: 10.1039/c9fo02602a. Epub 2020 May 6. Food Funct. 2020. PMID: 32374299
-
Ginsenoside Rg5 Inhibits Succinate-Associated Lipolysis in Adipose Tissue and Prevents Muscle Insulin Resistance.Front Pharmacol. 2017 Feb 14;8:43. doi: 10.3389/fphar.2017.00043. eCollection 2017. Front Pharmacol. 2017. PMID: 28261091 Free PMC article.
-
Mangiferin inhibits endoplasmic reticulum stress-associated thioredoxin-interacting protein/NLRP3 inflammasome activation with regulation of AMPK in endothelial cells.Metabolism. 2015 Mar;64(3):428-37. doi: 10.1016/j.metabol.2014.11.008. Epub 2014 Nov 28. Metabolism. 2015. PMID: 25499441
-
Role of NLRP3 inflammasome and oxidative stress in hepatic insulin resistance and the ameliorative effect of phytochemical intervention.Front Pharmacol. 2023 Jun 30;14:1188829. doi: 10.3389/fphar.2023.1188829. eCollection 2023. Front Pharmacol. 2023. PMID: 37456758 Free PMC article. Review.
Cited by
-
Paving the Road Toward Exploiting the Therapeutic Effects of Ginsenosides: An Emphasis on Autophagy and Endoplasmic Reticulum Stress.Adv Exp Med Biol. 2021;1308:137-160. doi: 10.1007/978-3-030-64872-5_12. Adv Exp Med Biol. 2021. PMID: 33861443
-
A narrative review of the pharmacology of ginsenoside compound K.Ann Transl Med. 2022 Feb;10(4):234. doi: 10.21037/atm-22-501. Ann Transl Med. 2022. PMID: 35280413 Free PMC article. Review.
-
Ginsenosides Rb1 Attenuates Chronic Social Defeat Stress-Induced Depressive Behavior via Regulation of SIRT1-NLRP3/Nrf2 Pathways.Front Nutr. 2022 May 12;9:868833. doi: 10.3389/fnut.2022.868833. eCollection 2022. Front Nutr. 2022. PMID: 35634375 Free PMC article.
-
Recent progress (2015-2020) in the investigation of the pharmacological effects and mechanisms of ginsenoside Rb1, a main active ingredient in Panax ginseng Meyer.J Ginseng Res. 2022 Jan;46(1):39-53. doi: 10.1016/j.jgr.2021.07.008. Epub 2021 Jul 30. J Ginseng Res. 2022. PMID: 35058726 Free PMC article. Review.
-
Ginsenoside Rc from Panax Ginseng Ameliorates Palmitate-Induced UB/OC-2 Cochlear Cell Injury.Int J Mol Sci. 2023 Apr 16;24(8):7345. doi: 10.3390/ijms24087345. Int J Mol Sci. 2023. PMID: 37108509 Free PMC article.
References
-
- Hager S.R., Jochen A.L., Kalkhoff R.K. Insulin resistance in normal rats infused with glucose for 72 h. Am J Physiol. 1991;260:E353–E362. - PubMed
-
- Rossetti L. Glucose toxicity: the implications of hyperglycemia in the pathophysiology of diabetes mellitus. Clin Invest Med. 1995;18:255–260. - PubMed
-
- Haber C.A., Lam T.K., Yu Z., Gupta N., Goh T., Bogdanovic E., Giacca A., Fantus I.G. N-acetylcysteine and taurine prevent hyperglycemia-induced insulin resistance in vivo: possible role of oxidative stress. Am J Physiol Endocrinol Metab. 2003;285:E744–E753. - PubMed
-
- Eizirik D.L., Cardozo A.K., Cnop M. The role for endoplasmic reticulum stress in diabetes mellitus. Endocr Rev. 2008;29:42–61. - PubMed
LinkOut - more resources
Full Text Sources
Other Literature Sources
Research Materials
Miscellaneous
