. 2016 Sep 30:7:1547.
doi: 10.3389/fmicb.2016.01547. eCollection 2016.

Comparative Genomic Analysis among Four Representative Isolates of Phytophthora sojae Reveals Genes under Evolutionary Selection

Affiliations

Comparative Genomic Analysis among Four Representative Isolates of Phytophthora sojae Reveals Genes under Evolutionary Selection

Wenwu Ye et al. Front Microbiol. .

Abstract

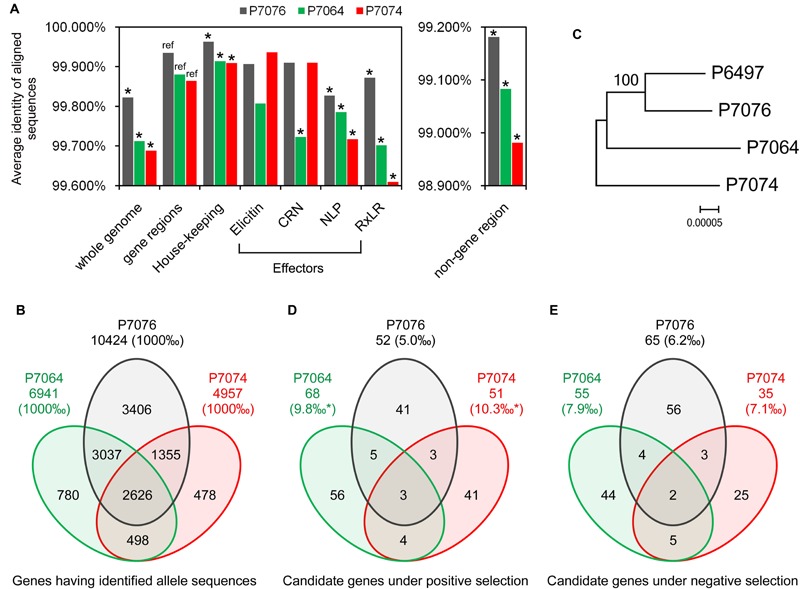
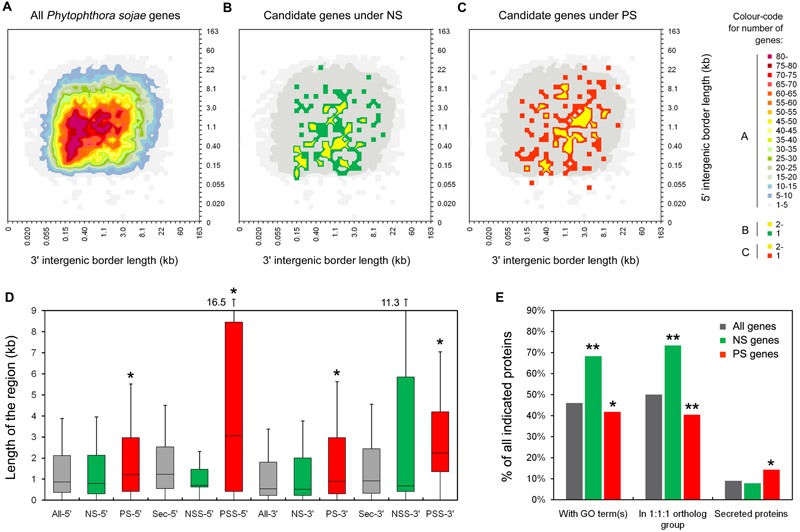
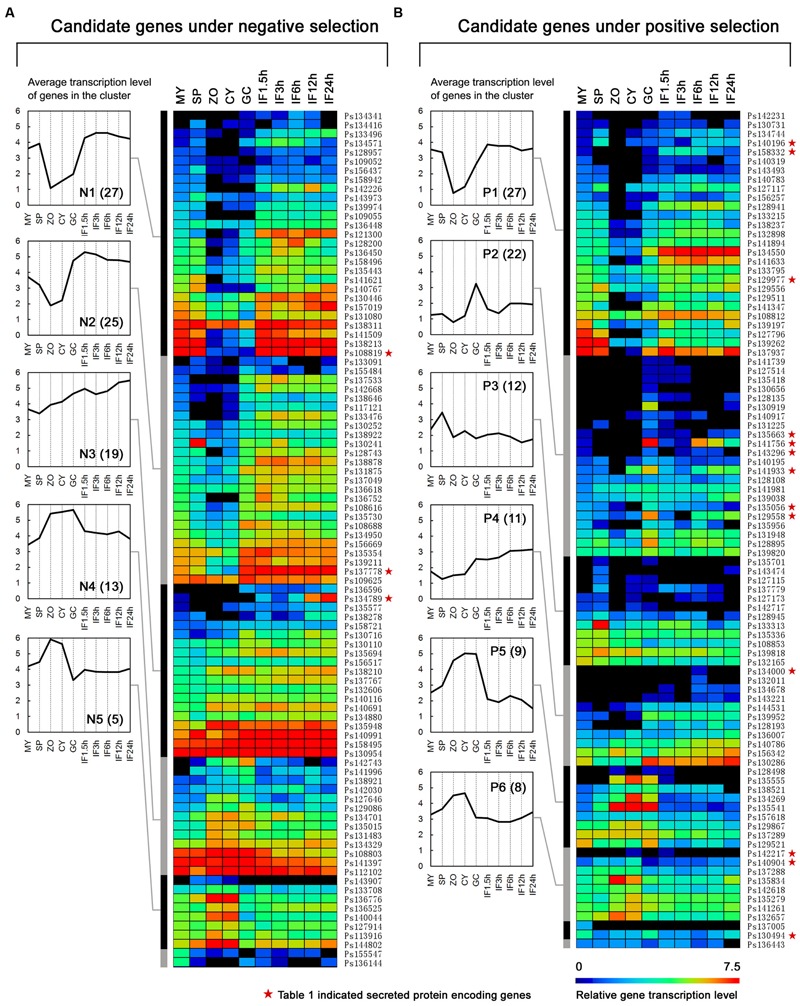
Comparative genomic analysis is useful for identifying genes affected by evolutionary selection and for studying adaptive variation in gene functions. In Phytophthora sojae, a model oomycete plant pathogen, the related study is lacking. We compared sequence data among four isolates of P. sojae, which represent its four major genotypes. These isolates exhibited >99.688%, >99.864%, and >98.981% sequence identities at genome, gene, and non-gene regions, respectively. One hundred and fifty-three positive selection and 139 negative selection candidate genes were identified. Between the two categories of genes, the positive selection genes were flanked by larger intergenic regions, poorly annotated in function, and less conserved; they had relatively lower transcription levels but many genes had increased transcripts during infection. Genes coding for predicted secreted proteins, particularly effectors, were overrepresented in positive selection. Several RxLR effector genes were identified as positive selection genes, exhibiting much stronger positive selection levels. In addition, candidate genes with presence/absence polymorphism were analyzed. This study provides a landscape of genomic variation among four representative P. sojae isolates and characterized several evolutionary selection-affected gene candidates. The results suggest a relatively covert two-speed genome evolution pattern in P. sojae and will provide clues for identification of new virulence factors in the oomycete plant pathogens.

Keywords: Phytophthora; comparative genomic analysis; effectors; evolution; positive selection.


Figures

FIGURE 1
FIGURE 1
Identification and polymorphism of the P. sojae alleles. (A) Average sequences identities of the whole genome, gene regions, and non-gene regions, using P6497 as a reference. Asterisk indicates a P < 0.001 from a hypergeometric test between the identity values, using value of gene regions as a reference. (B) Venn diagram showing the numbers of identified alleles in one or several isolate(s). (C) The Maximum-Likelihood phylogenetic tree was constructed based on super sequences that concatenated from 2626 genes, which had identified allele sequences in all of the four isolates. (D,E) Venn diagrams showing the numbers of candidate PS and NS genes in one or several isolate(s), respectively. Asterisk indicates a P < 0.001 from a χ2 test between the proportion values, using value of P7076 as a reference.
FIGURE 2
FIGURE 2
Characteristics of the candidate PS and NS genes. (A–C) Distribution of intergenic region lengths of all P. sojae genes (A), NS genes (B), and PS genes (C). (D) Boxplots showing the length of the 5′ and 3′ intergenic regions for all genes (All-), NS genes (NS-), PS genes (PS-), all secreted protein encoding genes (Sec-), secreted protein encoding NS genes (NSS-), and secreted protein encoding PS genes (PSS-) in P. sojae. Values inside each box correspond to the middle 50% of the data (between the 25th [Q1] and 75th [Q3] percentiles) and the line within the box represents the median. The whisker ends reach Q3+1.5IQR and Q1-1.5IQR (IQR = Q3-Q1), respectively. A significant difference between two sets of data (with a P < 0.05 from a Wilcoxon signed ranks test, using data of all genes as a reference), were marked with an asterisk. (E) Proportions of genes annotated with GO terms, in the 1:1:1 ortholog group, and predicted to encode classic secreted proteins. Comparing to “all genes”, data with significant differences (χ2 test) are marked with a single asterisk (P < 0.05) or double asterisks (P < 0.01).
FIGURE 3
FIGURE 3
Transcription patterns of the candidate NS genes (A) and PS genes (B). The heat map shows gene transcription patterns in 10 stages of the P. sojae life cycle: mycelia (MY), zoosporangia (SP), zoospores (ZO), cysts (CY), germinating cysts (GC), and samples from 1.5, 3, 6, 12, and 24 h post-inoculation of soybean leaves (IF1.5h to IF24h). The color bar represents log2 values of gene transcripts per million reads (TPM), ranging from dark blue (0) to red (7.5). Black represents no detected transcript. Transcription patterns are grouped into five (N1–N5) and six (P1–P6) major clusters using HCL methods and MEV software. The average gene transcription levels of these clusters are plotted and shown on the left of the heatmap. Gene numbers in each cluster are displayed in parentheses. Red stars mean the genes are also described in Table 1.

Similar articles

Cited by

References

    1. Adhikari B. N., Hamilton J. P., Zerillo M. M., Tisserat N., Levesque C. A., Buell C. R. (2013). Comparative genomics reveals insight into virulence strategies of plant pathogenic oomycetes. PLoS ONE 8:e75072 10.1371/journal.pone.0075072 - DOI - PMC - PubMed
    1. Altschul S. F., Gish W., Miller W., Myers E. W., Lipman D. J. (1990). Basic local alignment search tool. J. Mol. Biol. 215 403–410. 10.1016/S0022-2836(05)80360-2 - DOI - PubMed
    1. Baxter L., Tripathy S., Ishaque N., Boot N., Cabral A., Kemen E., et al. (2010). Signatures of adaptation to obligate biotrophy in the Hyaloperonospora arabidopsidis genome. Science 330 1549–1551. 10.1126/science.1195203 - DOI - PMC - PubMed
    1. Beakes G. W., Glockling S. L., Sekimoto S. (2012). The evolutionary phylogeny of the oomycete “fungi”. Protoplasma 249 3–19. 10.1007/s00709-011-0269-2 - DOI - PubMed
    1. Dong S., Kong G., Qutob D., Yu X., Tang J., Kang J., et al. (2012). The NLP toxin family in Phytophthora sojae includes rapidly evolving groups that lack necrosis-inducing activity. Mol. Plant Microbe Interact. 25 896–909. 10.1094/MPMI-01-12-0023-R - DOI - PubMed

LinkOut - more resources