. 2016 Sep 1;7(9):6132-6140.
doi: 10.1039/C6SC01469K. Epub 2016 Jun 9.

A Low Spin Manganese(IV) Nitride Single Molecule Magnet

Affiliations

A Low Spin Manganese(IV) Nitride Single Molecule Magnet

Mei Ding et al. Chem Sci. .

Abstract

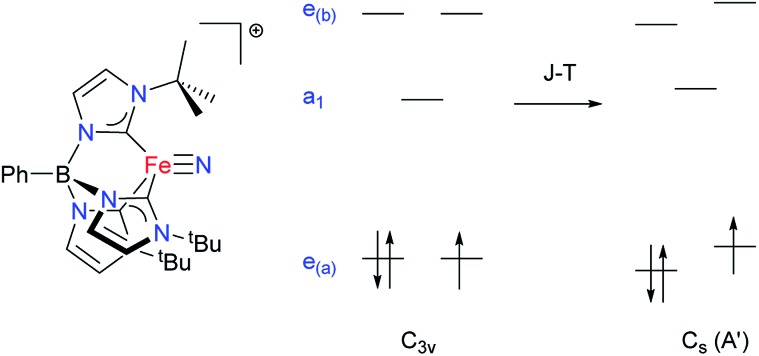
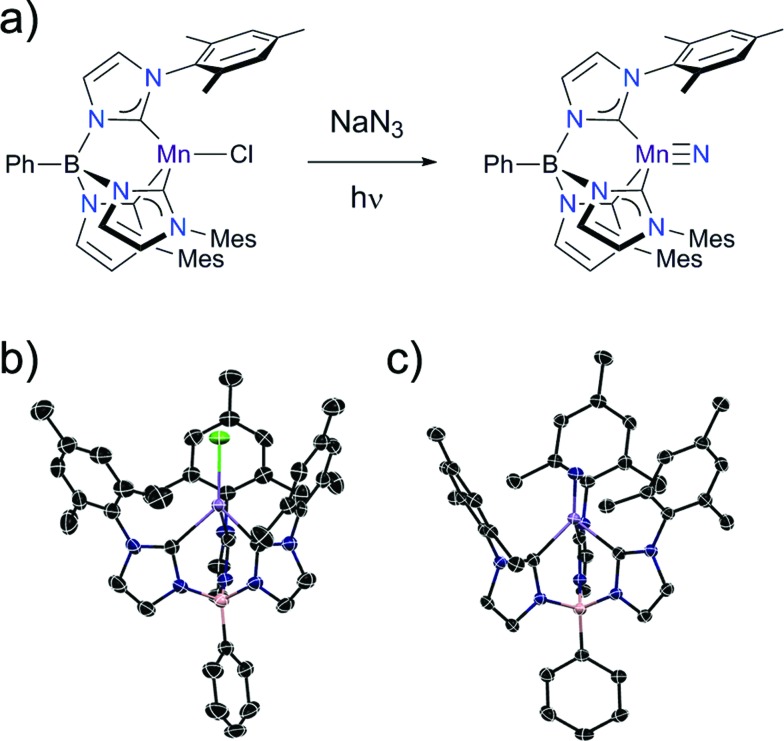
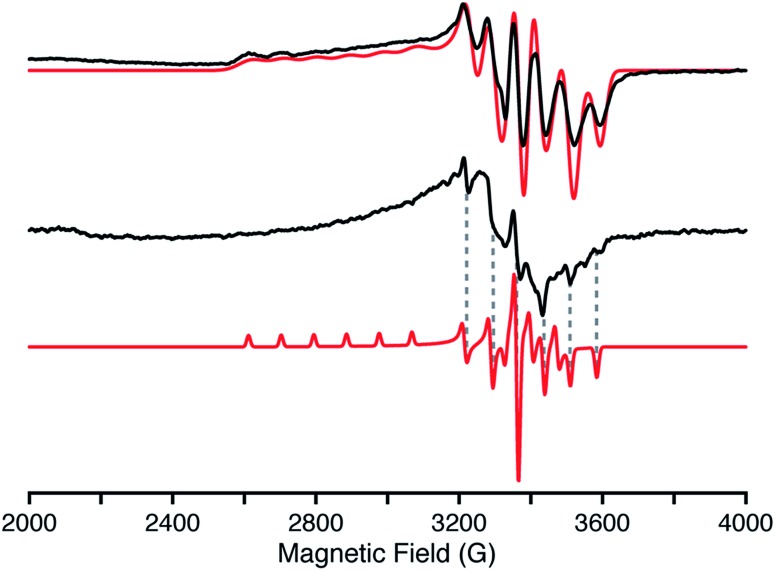
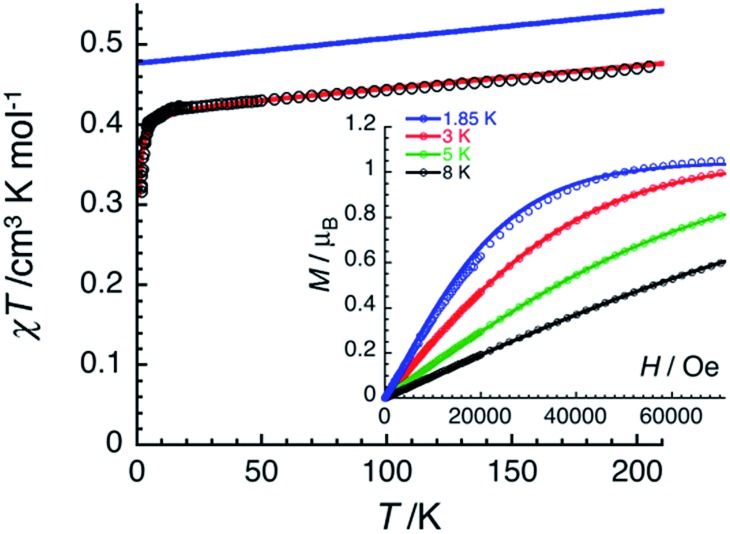
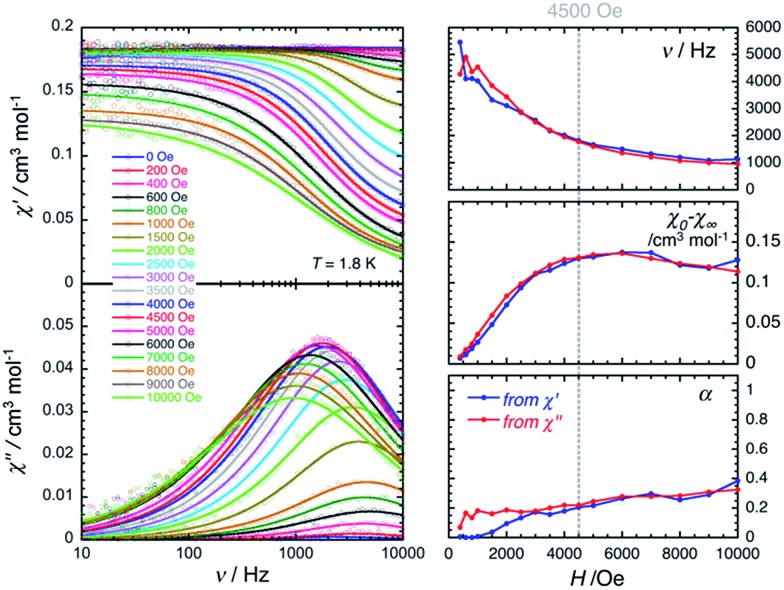
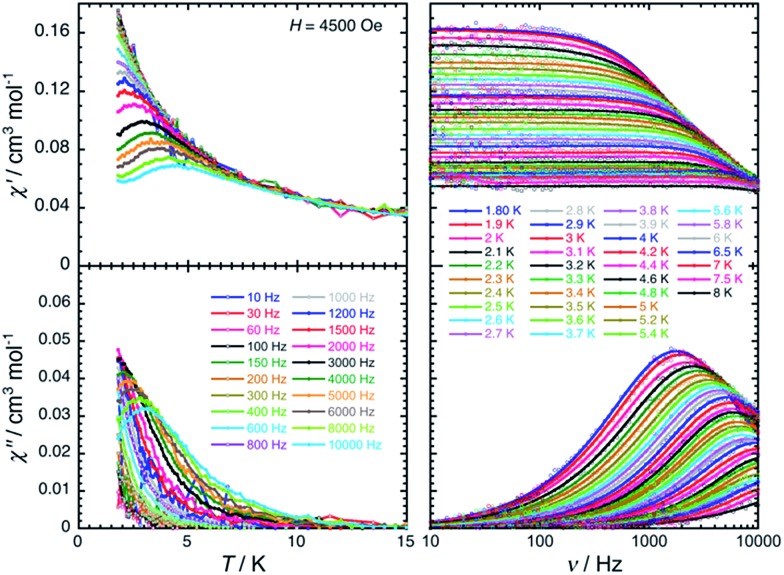
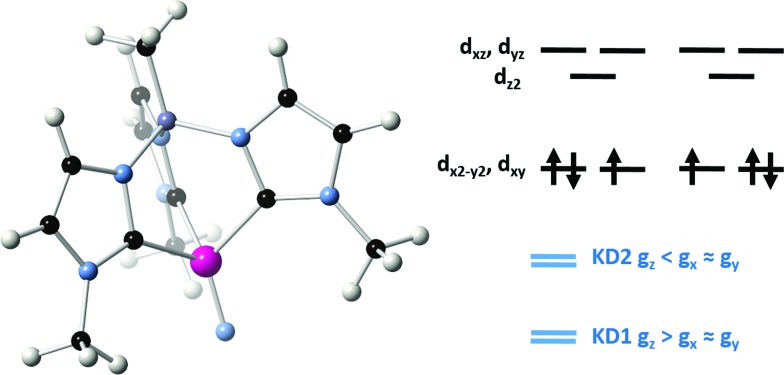
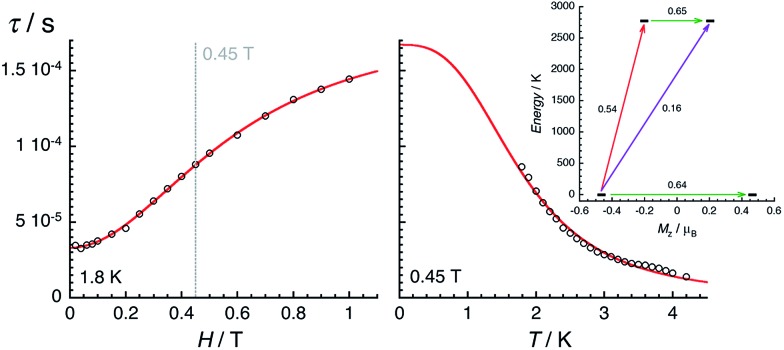
Structural, spectroscopic and magnetic methods have been used to characterize the tris(carbene)borate compound PhB(MesIm)3Mn≡N as a four-coordinate manganese(IV) complex with a low spin (S = 1/2) configuration. The slow relaxation of the magnetization in this complex, i.e. its single-molecule magnet (SMM) properties, is revealed under an applied dc field. Multireference quantum mechanical calculations indicate that this SMM behavior originates from an anisotropic ground doublet stabilized by spin-orbit coupling. Consistent theoretical and experiment data show that the resulting magnetization dynamics in this system is dominated by ground state quantum tunneling, while its temperature dependence is influenced by Raman relaxation.


Figures

Fig. 1
Fig. 1. Qualitative illustration of the effect of the Jahn–Teller distortion on the d-orbital splitting in a four-coordinate Fe(v) nitride complex. Due to e–e-mixing, the extent of splitting need not be the same for both sets of e levels.
Fig. 2
Fig. 2. (a) Synthesis of PhB(MesIm)3MnN (2) and X-ray crystal structures of (b) PhB(MesIm)3MnII–Cl (1), and (c) PhB(MesIm)3MnIVN (2) with thermal ellipsoids shown at 50% probability; H atoms are omitted for clarity. Black, blue, lilac, pink and green ellipsoids represent C, N, Mn, B and Cl atoms, respectively.
Fig. 3
Fig. 3. X-Band (9.37 GHz) continuous-wave EPR of 2 in solution (top) and suspended powder (middle) with simulations (red) collected at 20 K with 100 kHz field modulation (4 G modulation amplitude). The solution exhibits an axial EPR and is simulated by the following parameters: g = [g1, g2, g3] = [2.35, 1.973, 1.965]; A(55Mn) = [A1, A2, A3] = [300, 74, 202] MHz; EPR lw = [250, 85, 85] MHz. The suspended powder (slurry) exhibits very anisotropic EPR linewidths of the three conical g-values. An EPR simulation with isotropic linewidths (25 MHz) is shown (bottom) as a visual aid to the reader to identify the A3 hyperfine features (dashed lines).
Fig. 4
Fig. 4. High-resolution Mn 2p spectra of (a) PhB(MesIm)3MnN (2) and (c) PhB(MesIm)3MnCl (1). The black line represents the experimental data, the red line shows the fit, and the blue and green lines represent Mn 2p3/2 and Mn 2p1/2 components, respectively, while the brown line represents shake-up satellites. See Table S3 for fitting parameters. High-resolution Mn 3s spectra of (b) PhB(MesIm)3MnN (2) and (d) PhB(MesIm)3MnCl (1). The black line represents the experimental data, the red line shows fit, and the blue and green lines represent Mn 3s split components. See Table S4 for fitting parameters.
Fig. 5
Fig. 5. Temperature dependence of the χT product at 0.1 T (χ is defined as magnetic susceptibility equal to M/H per mole of 2). Inset: field dependence of the magnetization below 8 K for 2 (8–200 mT min–1). Solid lines are simulations discussed in the text.
Fig. 6
Fig. 6. Left part: Frequency dependence of the real (χ′, top) and imaginary (χ′′, bottom) parts of the ac susceptibility at 1.8 K at different dc fields between 0 and 1 T for a polycrystalline sample of 2. Solid lines are the best fits of the experimental data to the generalized Debye model. Right part: Temperature dependence of the magnetic parameters deduced from the fits of the χvs. ν (blue dots) and χ′′ vs. ν (red dots) data shown in the left part of the figure using the generalized Debye model (ν: characteristic ac frequency; χ0χ: amplitude of the relaxation mode with χ0 and χ being the in-phase ac susceptibilities in the zero and infinite ac frequency limits, respectively; α: the distribution of the relaxation). The solid lines are guides for the eyes.
Fig. 7
Fig. 7. Temperature (left) and frequency (right) dependences of the real (χ′, top) and imaginary (χ′′, bottom) parts of the ac susceptibility, between 1.8 and 15 K and between 10 and 10 000 Hz respectively, for 2 in a 0.45 T dc field. Solid lines are visual guides on the left part of the figure and are the best fits of the experimental data to the generalized Debye model.
Fig. 8
Fig. 8. Left: Model complex for 2 used in the electronic structure calculations. Color code: Mn (magenta); N (light blue); C (black); B (purple); H (white). Right, top: Main orbital configurations contributing to the ground state. Right, bottom: Relation between components of the g tensor of the first two Kramers' doublets (KD1 and KD2).
Fig. 9
Fig. 9. Field (left, at 1.8 K) and temperature (right, at 0.45 T) dependences of the average relaxation time for 2 estimated from the Fig. 6 and 7. The red lines are the best fits obtained with the theoretical approach developed in the text. Inset: lowest two Kramers doublets and ab initio computed relaxation mechanism with the MOLCAS code (CASSCF + RASSI level). The thick black lines are Kramers doublets shown as a function of their magnetic moment, Mz, along the main anisotropy axis (z). The green arrows correspond to the quantum tunnelling mechanism (QTM) of ground and first excited states while purple arrow shows the hypothetical Orbach relaxation process. The red arrow indicates the transition between the ground and first KDs. The values close to the arrows indicate the matrix elements of the transition magnetic moments (above 0.1, an efficient spin relaxation mechanism is expected). Thus, this figure highlights that the QTM through the Kramers doublet ground state is dominating the relaxation process at low temperatures.

References

    1. Freedman D. E., Harman W. H., Harris T. D., Long G. J., Chang C. J., Long J. R. J. Am. Chem. Soc. 2010;132:1224. - PubMed
    1. Layfield R. A. Organometallics. 2014;33:1084.
    2. Gómez-Coca S., Aravena D., Morales R., Ruiz E. Coord. Chem. Rev. 2015;289–290:379.
    3. Craig G. A., Murrie M. Chem. Soc. Rev. 2015;44:2135. - PubMed
    4. Frost J. M., Harriman K. L. M., Murugesu M. Chem. Sci. 2016;7:2470. - PMC - PubMed
    1. Abragam A. and Bleaney B., Electron Paramagnetic Resonance of Transition Ions, Dover, New York, 1986.
    1. Gatteschi D., Sessoli R. and Villain J., Molecular Nanomagnets, Oxford University Press, Oxford, 2006.
    1. Zadrozny J. M., Xiao D. J., Atanasov M., Long G. J., Grandjean F., Neese F., Long J. R. Nat. Chem. 2013;5:577. - PubMed