. 2016 Sep 29:6:114.
doi: 10.3389/fcimb.2016.00114. eCollection 2016.

Shiga Toxin Mediated Neurologic Changes in Murine Model of Disease

Affiliations

Shiga Toxin Mediated Neurologic Changes in Murine Model of Disease

Suman Pradhan et al. Front Cell Infect Microbiol. .

Abstract

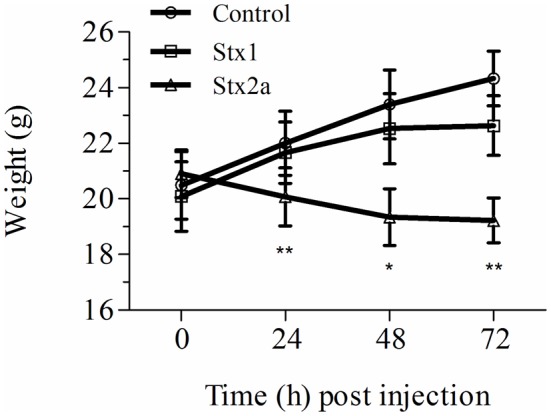
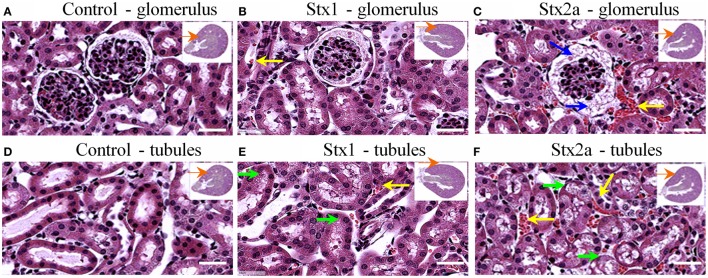
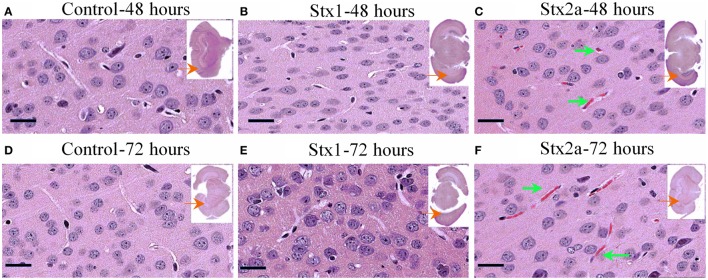
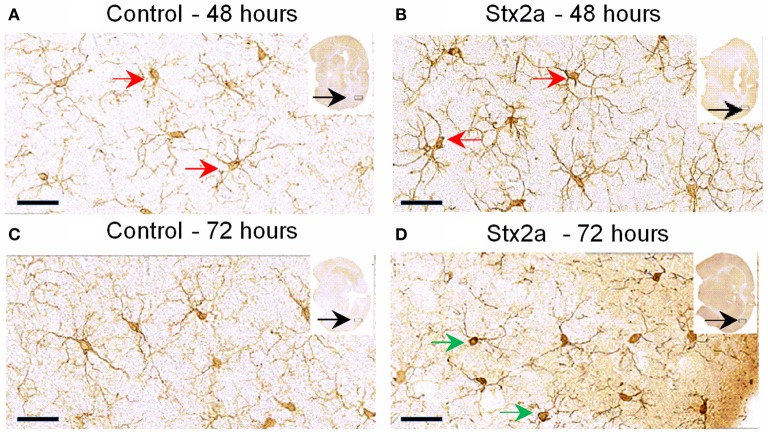
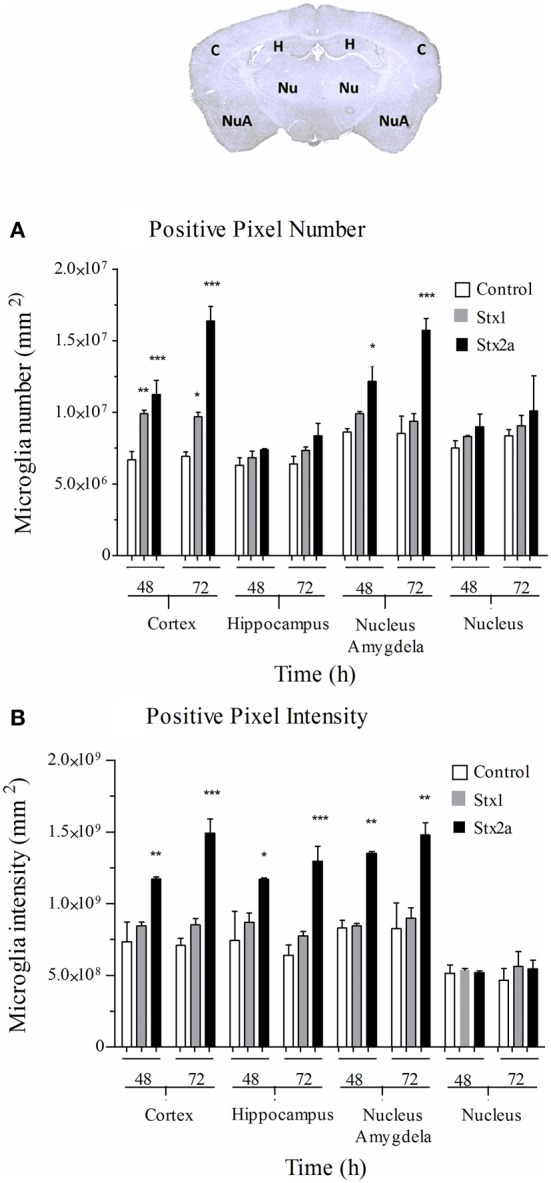
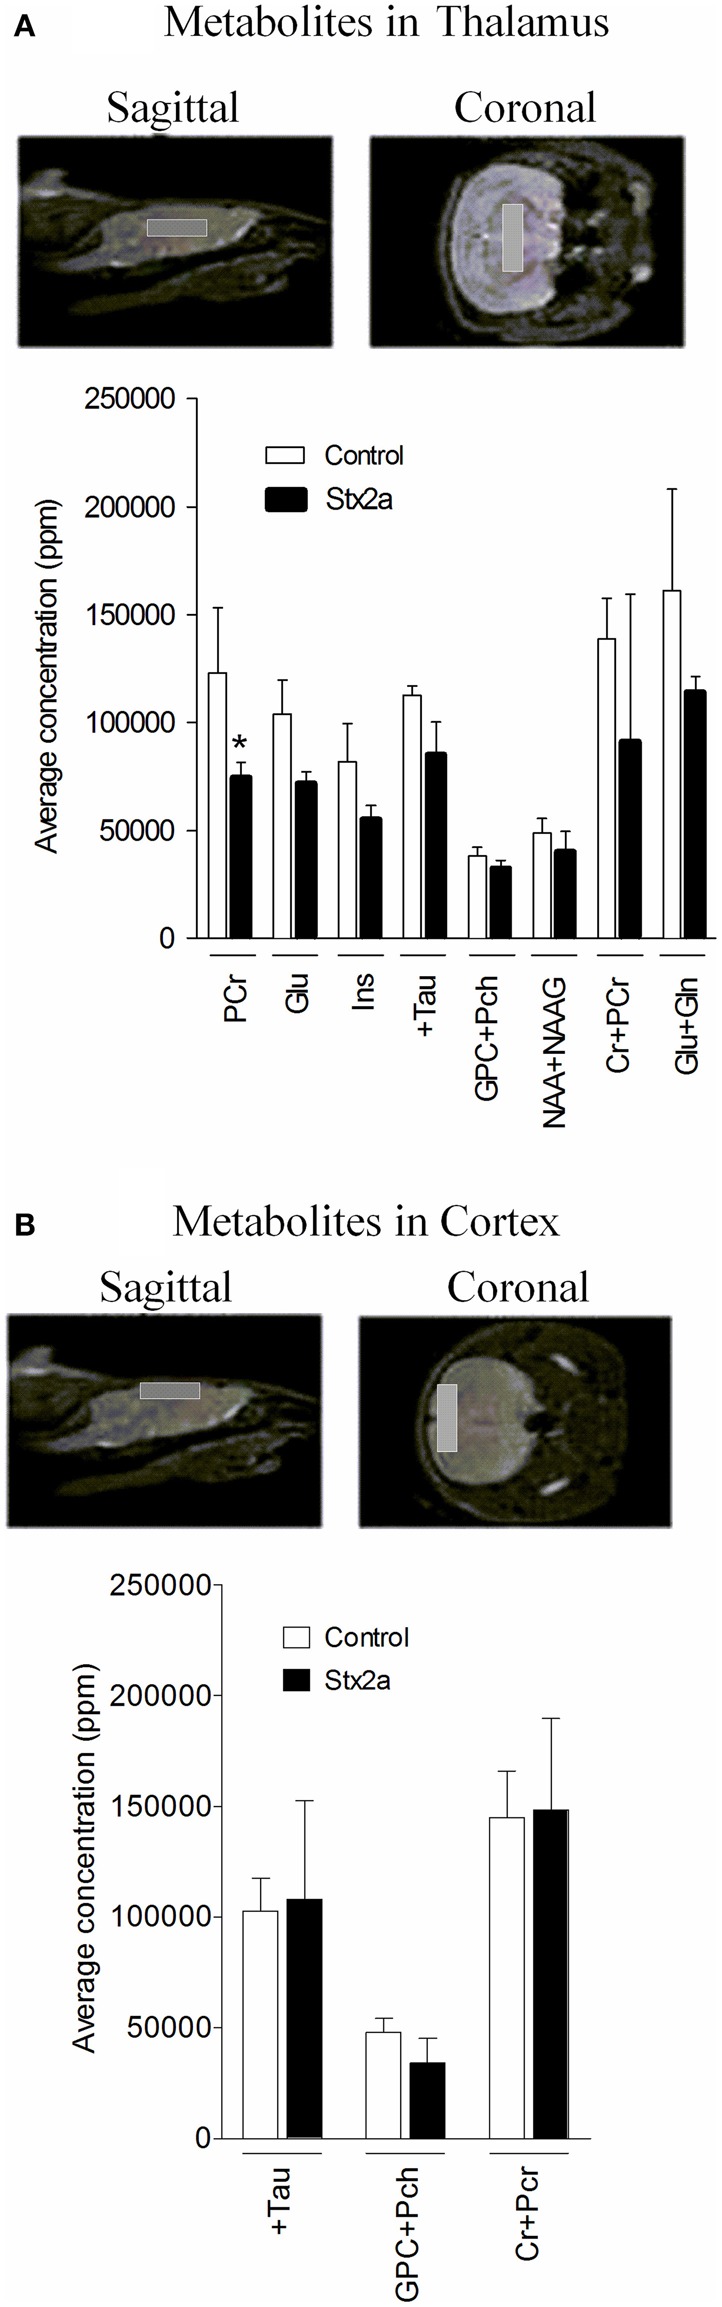
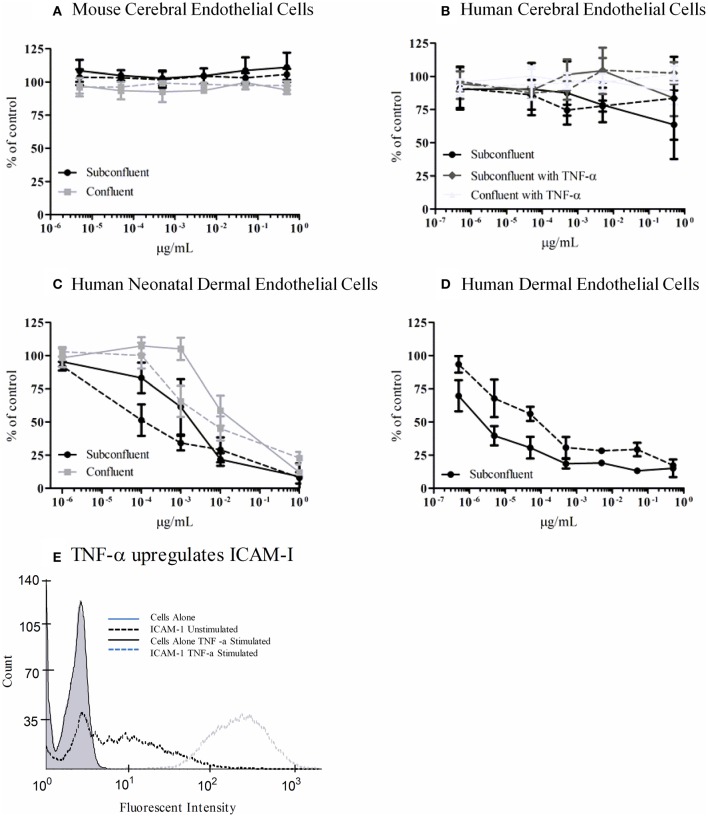
Seizures and neurologic involvement have been reported in patients infected with Shiga toxin (Stx) producing E. coli, and hemolytic uremic syndrome (HUS) with neurologic involvement is associated with more severe outcome. We investigated the extent of renal and neurologic damage in mice following injection of the highly potent form of Stx, Stx2a, and less potent Stx1. As observed in previous studies, Stx2a brought about moderate to acute tubular necrosis of proximal and distal tubules in the kidneys. Brain sections stained with hematoxylin and eosin (H&E) appeared normal, although some red blood cell congestion was observed. Microglial cell responses to neural injury include up-regulation of surface-marker expression (e.g., Iba1) and stereotypical morphological changes. Mice injected with Stx2a showed increased Iba1 staining, mild morphological changes associated with microglial activation (thickening of processes), and increased microglial staining per unit area. Microglial changes were observed in the cortex, hippocampus, and amygdala regions, but not the nucleus. Magnetic resonance imaging (MRI) of Stx2a-treated mice revealed no hyper-intensities in the brain, although magnetic resonance spectroscopy (MRS) revealed significantly decreased levels of phosphocreatine in the thalamus. Less dramatic changes were observed following Stx1 challenge. Neither immortalized microvascular endothelial cells from the cerebral cortex of mice (bEnd.3) nor primary human brain microvascular endothelial cells were found to be susceptible to Stx1 or Stx2a. The lack of susceptibility to Stx for both cell types correlated with an absence of receptor expression. These studies indicate Stx causes subtle, but identifiable changes in the mouse brain.

Keywords: H&E staining; Iba1 antibody; bacterial toxin; microglia activation; mouse brain.


Figures

Figure 1
Figure 1
Weight gain in Stx-treated mice. Three groups of initially 16 mice were injected with either PBS (control), Stx1 (1500 ng), or Stx2a (7 ng), and weighed prior to sacrificing four mice every 24 h for histological studies. The average weight of the remaining mice at each time point is plotted. As observed in previous studies, mice injected with PBS (circles) gained weight over the 72 h period, while injection of Stx2a (triangles) resulted in a statistically significant loss of weight at 24, 48, and 72 h post-injection (*P < 0.01, **P < 0.0032). Compared to the PBS alone injected population, mice injected with Stx1 (squares) gained less weight, although the differences were not statistically significant.
Figure 2
Figure 2
H&E staining of kidney tissue at 72 h post-injection. Transverse sections of kidney tissue showing glomeruli (A–C) and tubules (D–F) of mice from Figure 1 injected with: PBS (A,D); 1500 ng Stx1 (B,E); 7 ng Stx2a (C,F). Stx2a-treated mice show increased spacing in the Bowman's capsule (C, blue arrow). Red blood cell congestion is seen in the Stx2a-treated mice (C,F, yellow arrows) and to a lesser extent in the Stx1-treated mice (B,E, yellow arrows), but not in the kidneys of control mice. Tubular necrosis was seen in animals receiving Stx1 (E, green arrows), but these lesions were much more prominent in animals receiving Stx2a (F, green arrows). Scale bar represent 50 μm. Insert, orange arrow indicates approximate position of the magnified image.
Figure 3
Figure 3
H&E staining of coronal sections of brain tissue. Mice from Figure 1 injected with PBS (A,D); 1500 ng Stx1 (B,E); 7 ng Stx2a (C,F) sacrificed at the indicated times. Sections of the Stx2a injected mice show accumulation or congestion of red blood cells in the vesicles (C,F, green arrows), not seen in the sections injected with PBS alone or Stx1. Scale bar represent 50 μm. Insert, entire brain scan where black arrow indicates approximate position of the magnified image.
Figure 4
Figure 4
Mouse brain temporal lobe of the cortex region stained for the microglial marker, Iba1: Cross sections of brain tissue injected with PBS control (A,C), and Stx2a (7 ng) B,D; (A,B), 48 h, (C,D) 72 h post-injection. Compared to controls at 48 h, brains of mice injected with Stx2a show an increase in the intensity of Iba1 staining of microglial cell bodies and processes (red arrows). At 72 h post-injection with Stx2a, morphologic change from the ramified (resting stage) characterized by long branching processes, to the activated macrophage-like globular structure displaying few processes and a more intensely stained cell body (D, green arrows) is observed. Scale bar represent 50 μm. Insert, entire brain scan where orange arrow indicates approximate position of the magnified image (n = 4).
Figure 5
Figure 5
Quantification of microglial Iba1 staining. Pixel count in the indicated regions of the brain (top) of mice in Figure 4: injected with PBS (open bars); 1500 ng Stx1 (gray bars); or 7 ng Stx2a (black bars) at 48 and 72 h post-injection. (A) total positive pixel count (corresponding to microglial cell numbers). Compared to controls, for Stx2a treated mice statistically significant increases in the total pixel numbers were seen in the cortex and nucleus amygdela at 48 and 72 h. (B) total pixel intensity (indicative of microglial activation). Statistically significant increases in pixel intensity were seen for Stx2a at both 48 and 72 h throughout the brain with exception to the nucleus. Aperio Imagescope v12 software was used to annotate areas of interest and perform image analysis. (n = 4). P-values were *P < 0.05; **P < 0.04; and ***P < 0.02.
Figure 6
Figure 6
Concentrations of brain metabolites. MRI is shown indicating approximate placement of the sagittal and coronal voxel for thalamus (A) and cortex (B). Average metabolite concentrations plotted as mean ± SD for control, PBS injected (n = 3 mice) and 3 ng Stx2a-injected (n = 4 mice). Metabolites detected include: PCr, phosphocreatine; Glu, glutamic acid; Ins, myo-inositol; + Tau, taurine; GPC + Pch, choline-containing compounds; NAA + NAAG; N-acetylaspartylglutamate + N-acetylaspartate; Cr + PCr, creatine + phosphocreatine; and Glu + Gln, glutamic acid + glutamine. Two tailed Student's t-test was used to assess statistical significance (*P < 0.03).
Figure 7
Figure 7
Metabolic activity of Stx-treated microvascular endothelial cells. bEnd.3 immortalized mouse cerebral cortex microvascular endothelial cells (A), primary human cerebral cortex microvascular endothelial cells (B), primary human neonatal dermal microvascular endothelial cells (C), and CDC.HMEC-1 immortalized human dermal microvascular endothelial cells (D) were incubated with Stx1 (solid lines) or Stx2a (dashed lines) for 42 h. The toxin containing media was removed and fresh media containing 10% alamarBlue was added. Cells were incubated for an additional 3 h and the fluorescent reduction of alamarBlue was measured every 30 min. The 1 h time point is shown except for subconfluent BMECs which depicts the 3 h time point. Graphs depict toxin-treated cells as a percent of untreated control cells. Results are the average of three individual experiments and error bars correspond to standard deviation of the mean. TNF-α upregulates surface ICAM-1 (E). Human brain endothelial cells were incubated with 10 ng/ml TNF-α for 24 h, stained for surface expression of ICAM-1 (CD54) and analyzed by FACS.

References

    1. Armstrong G. D., Mulvey G. L., Marcato P., Griener T. P., Kahan M. C., Tennent G. A., et al. . (2006). Human serum amyloid P component protects against Escherichia coli O157:H7 Shiga toxin 2 in vivo: therapeutic implications for hemolytic-uremic syndrome. J. Infect. Dis. 193, 1120–1124. 10.1086/501472 - DOI - PubMed
    1. Bauwens A., Bielaszewska M., Kemper B., Langehanenberg P., von Bally G., Reichelt R., et al. . (2010). Differential cytotoxic actions of Shiga toxin 1 and Shiga toxin 2 on microvascular and macrovascular endothelial cells. Thromb. Haemost. 105, 515–528. 10.1160/TH10-02-0140 - DOI - PubMed
    1. Boerlin P., McEwen S. A., Boerlin-Petzold F., Wilson J. B., Johnson R. P., Gyles C. L. (1999). Associations between virulence factors of Shiga toxin-producing Escherichia coli and disease in humans. J. Clin. Microbiol. 37, 497–503. - PMC - PubMed
    1. Ching J. C. Y., Jones N. L., Ceponis P. J. M., Karmali M. A., Sherman P. M. (2002). Escherichia coli Shiga-like toxins induce apoptosis and cleavage of poly(ADP-ribose) polymerase via in vitro activation of caspases. Infect. Immun. 70, 4669–4677. 10.1128/IAI.70.8.4669-4677.2002 - DOI - PMC - PubMed
    1. Cimolai N., Carter J. (1998). Bacterial genotype and neurological complications of Escherichia coli O157:H7-associated haemolytic uraemic syndrome. Acta Paediatr. 87, 593–594. 10.1111/j.1651-2227.1998.tb01510.x - DOI - PubMed

MeSH terms