

Physical activity and incident type 2 diabetes mellitus: a systematic review and dose-response meta-analysis of prospective cohort studies
- PMID: 27747395
- PMCID: PMC6207340
- DOI: 10.1007/s00125-016-4079-0
Physical activity and incident type 2 diabetes mellitus: a systematic review and dose-response meta-analysis of prospective cohort studies
Abstract
Aims/hypothesis: Inverse associations between physical activity (PA) and type 2 diabetes mellitus are well known. However, the shape of the dose-response relationship is still uncertain. This review synthesises results from longitudinal studies in general populations and uses non-linear models of the association between PA and incident type 2 diabetes.
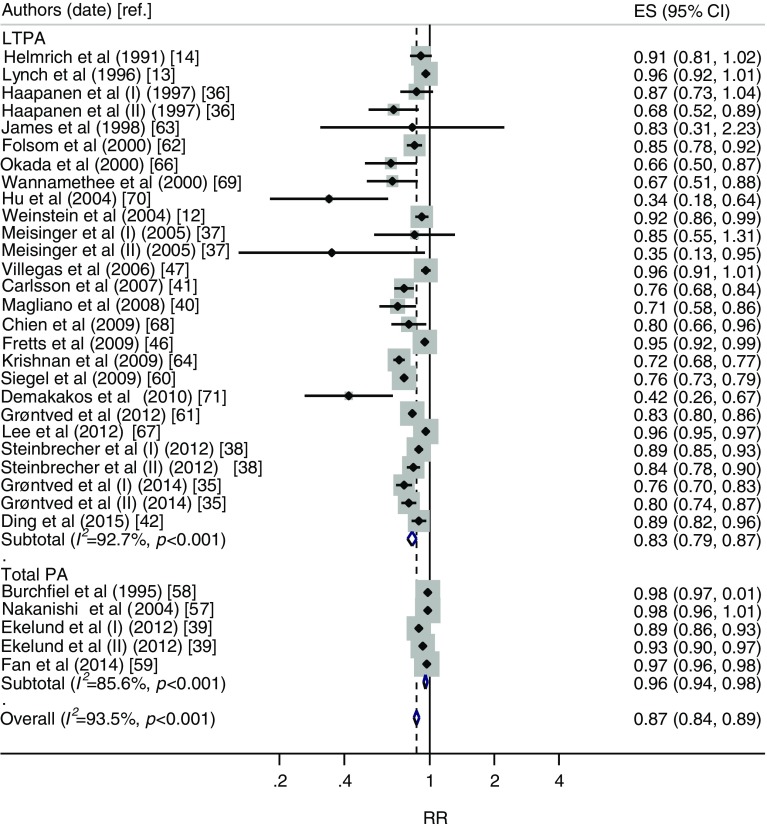
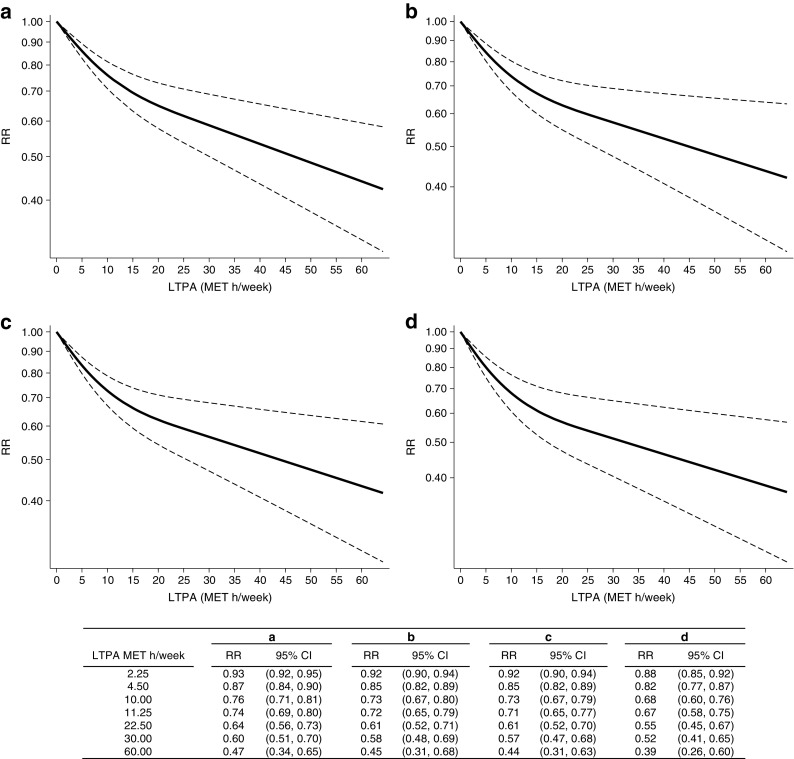
Methods: A systematic literature search identified 28 prospective studies on leisure-time PA (LTPA) or total PA and risk of type 2 diabetes. PA exposures were converted into metabolic equivalent of task (MET) h/week and marginal MET (MMET) h/week, a measure only considering energy expended above resting metabolic rate. Restricted cubic splines were used to model the exposure-disease relationship.
Results: Our results suggest an overall non-linear relationship; using the cubic spline model we found a risk reduction of 26% (95% CI 20%, 31%) for type 2 diabetes among those who achieved 11.25 MET h/week (equivalent to 150 min/week of moderate activity) relative to inactive individuals. Achieving twice this amount of PA was associated with a risk reduction of 36% (95% CI 27%, 46%), with further reductions at higher doses (60 MET h/week, risk reduction of 53%). Results for the MMET h/week dose-response curve were similar for moderate intensity PA, but benefits were greater for higher intensity PA and smaller for lower intensity activity.
Conclusions/interpretation: Higher levels of LTPA were associated with substantially lower incidence of type 2 diabetes in the general population. The relationship between LTPA and type 2 diabetes was curvilinear; the greatest relative benefits are achieved at low levels of activity, but additional benefits can be realised at exposures considerably higher than those prescribed by public health recommendations.
Keywords: Cohort studies; Dose–response; Meta-analysis; Physical activity; Systematic review; Type 2 diabetes.
Conflict of interest statement
Access to research materials
Information about how the data can be accessed is available from the corresponding author.
Duality of interest
The authors declare that there is no duality of interest associated with this manuscript
Contribution statement
JW and SB conceived this study. ADS and AC contributed to the design of the study. ADS conducted data collection. ADS and AC conducted the analysis. JW, SB, AC and ADS interpreted the results. ADS wrote the initial draft of the manuscript, with revisions by all authors. The final manuscript was approved by all authors. ADS, JWS and SB are the guarantors of this work.
Figures
References
-
- International Diabetes Federation . IDF diabetes atlas. 7. Brussels: International Diabetes Federation; 2015. - PubMed
Publication types
MeSH terms
Grants and funding
LinkOut - more resources
Full Text Sources
Other Literature Sources
Medical
Miscellaneous
