. 2016 Oct 17:6:35205.
doi: 10.1038/srep35205.

MicroRNA-127 targeting of mitoNEET inhibits neurite outgrowth, induces cell apoptosis and contributes to physiological dysfunction after spinal cord transection

Affiliations

MicroRNA-127 targeting of mitoNEET inhibits neurite outgrowth, induces cell apoptosis and contributes to physiological dysfunction after spinal cord transection

Qin-Qin He et al. Sci Rep. .

Erratum in

Abstract

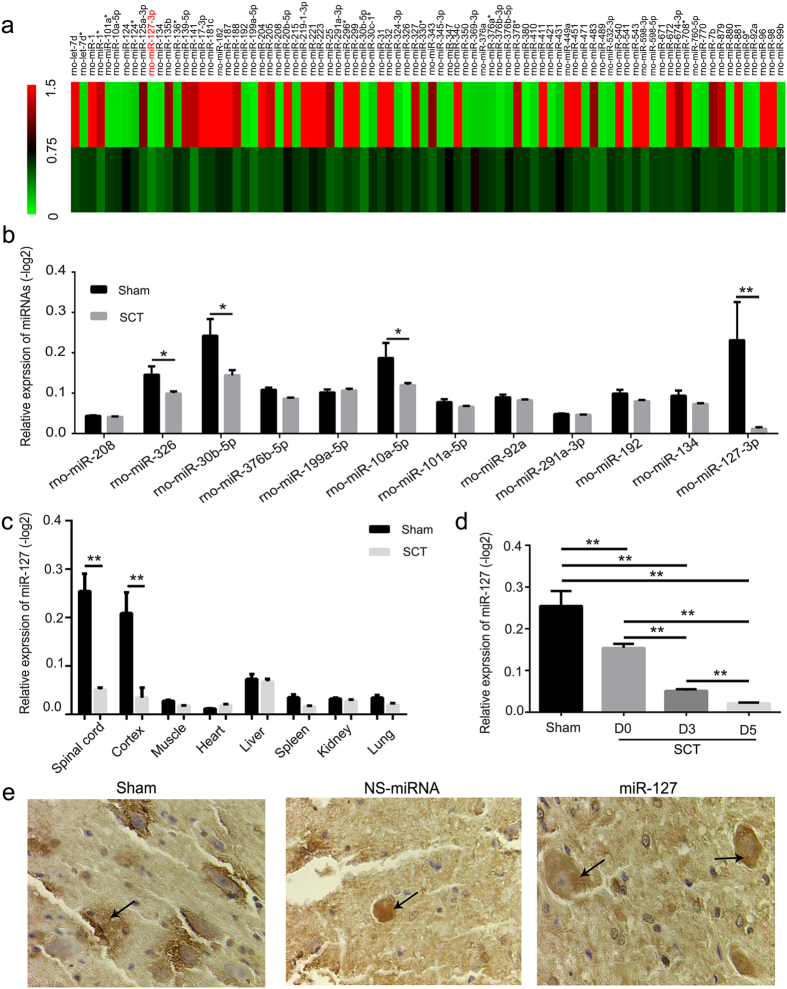
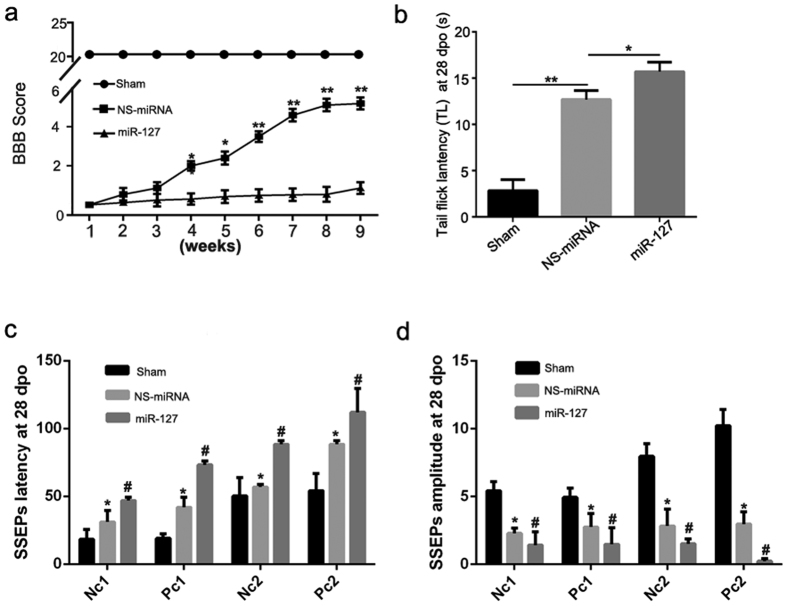
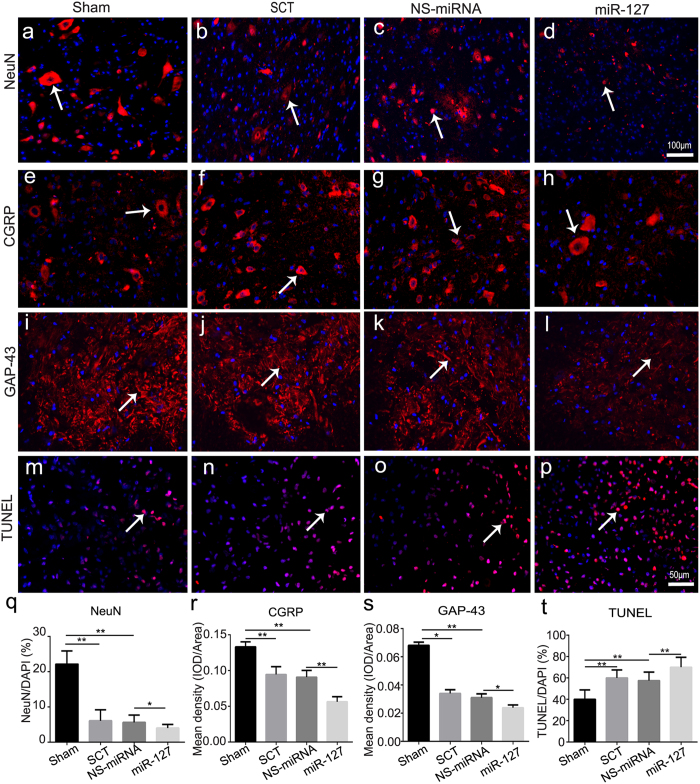
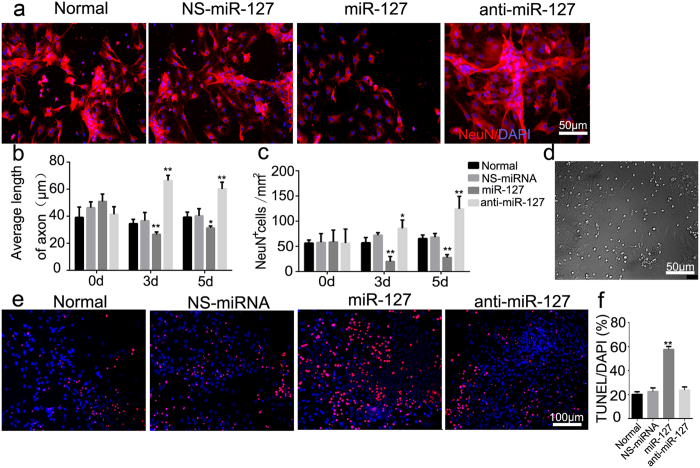
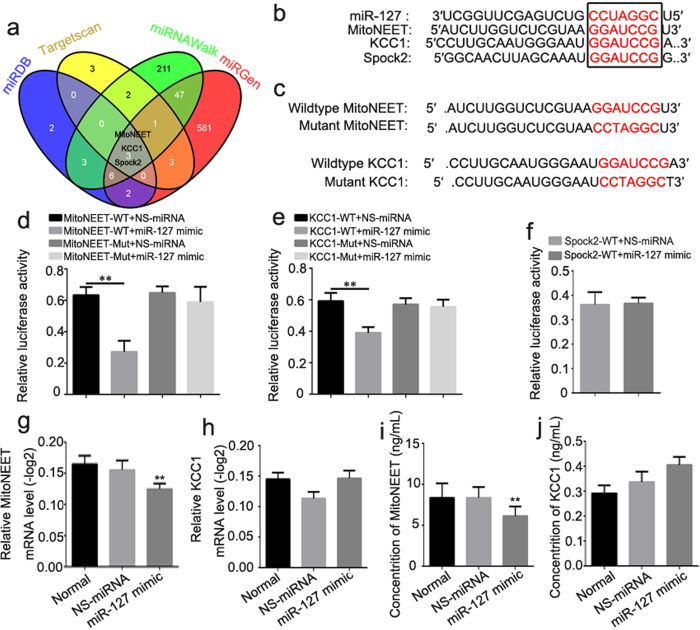
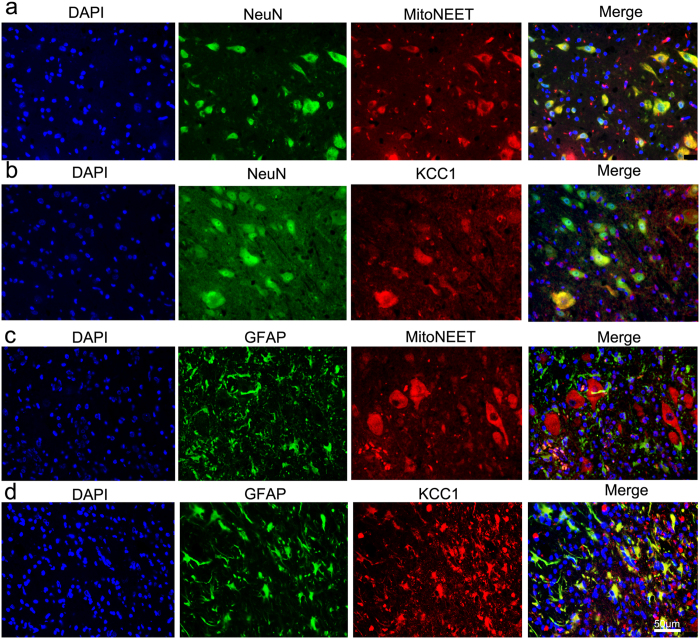
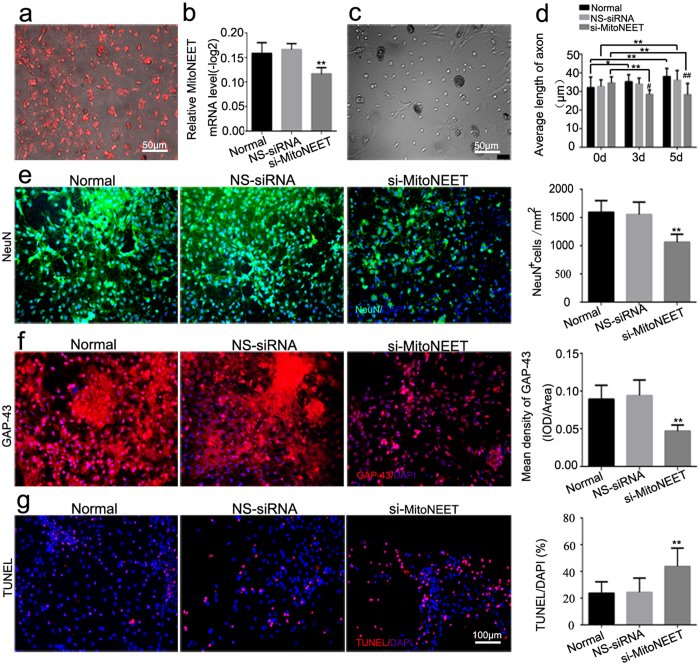
Neuroregeneration and apoptosis are two important pathophysiologic changes after spinal cord injury (SCI), but their underlying mechanisms remain unclear. MicroRNAs (miRNAs) play a crucial role in the regulation of neuroregeneration and neuronal apoptosis, research areas that have been greatly expanded in recent years. Here, using miRNA arrays to profile miRNA transcriptomes, we demonstrated that miR-127-3p was significantly down-regulated after spinal cord transection (SCT). Then, bioinformatics analyses and experimental detection showed that miR-127-3p exhibited specific effects on the regulation of neurite outgrowth and the induction of neuronal apoptosis by regulating the expression of the mitochondrial membrane protein mitoNEET. Moreover, knockdown of MitoNEET leaded to neuronal loss and apoptosis in primary cultured spinal neurons. This study therefore revealed that miR-127-3p, which targets mitoNEET, plays a vital role in regulating neurite outgrowth and neuronal apoptosis after SCT. Thus, modificatioin of the mitoNEET expression, such as mitoNEET activition may provide a new strategy for the treatment of SCI in preclinical trials.


Figures

Figure 1
Figure 1. MicroRNA-127 was one of the spinal cord enriched miRNAs with a significant down-regulation after SCT.
(a) 3 dpo, forty-two microRNAs were down-regulated 2-fold and forty-two microRNAs were up-regulated 2-fold after SCT compared to the sham group, which were normalized to −log 2 and plotted as a heat map. The color code in the heat maps is linear, with green as the lowest and red as the highest. (b) 3 dpo, miRNA array data were verified by qRT-PCR. The fold change values indicated the relative change in the expressional levels between samples and the internal control (U6), assuming that the value of the U6 expression level of each sample was equal to 1. And expression of miRNA in each group was presented as mean ± SE relative to −log2. n = 5/group. (c) qRT-PCR analysis of miR-127 expression in spinal cord, cortex, liver, muscle, spleen, kidney, heart and lung using total RNA isolated from the sham and SCT rats. Each bar is the mean ± SE relative to −log2. *P < 0.05, **P < 0.01. n = 5/group. (d) qRT-PCR analysis of miR-127 expression at D0, D3 and D5. **P < 0.01. n = 5/group. D0, D3 and D5 represent day 0, day 3 and day 5 post operation. (e) The localization of miR-127 in spinal cord tissue was detected by in situ hybridization 28 days after SCT. MiR-127 was localized in the cytoplasm of neurons following SCT (arrows). Scale bar = 50 μm.
Figure 2
Figure 2. miR-127 exacerbated dysfunction after SCT.
(a) miR-127 exacerbated the locomotor function deficit following SCT. Functional recovery in hindlimb was assessed from week 1 to week 9 after SCT with Basso, Beattie, and Bresnahan (BBB) Scores. Hindlimb dysfunction was exacerbated with treatment of miR-127 agomir when compared with NS-miRNA group. Three independent experiments were performed and the data are presented as the means ± SEM. *P < 0.05, **P < 0.01, compared with NS-miRNA group. n = 5 at least/group. (b) Tail-flick latency (TL) in each group was evaluated at 28 days after SCT. Data were presented as means ± SEM. *P < 0.05, **P < 0.01, compared with NS-miRNA group. n = 5/group. (c,d) Latency and amplitude of SSEPs signals in each group was evaluated at 28 days after SCT. Data were presented as means ± SEM. *P < 0.05 versus sham group, #P < 0.05 versus NS-miRNA group. n = 5/group.
Figure 3
Figure 3. MiR-127 increased neuronal loss, promoted cell apoptosis and inhibited axonal regeneration after SCT.
Slices of rostral spinal cord derived from 28 dpo were subjected to immunohistochemistry for NeuN (ad, red, white arrow), CGRP (eh, red, white arrow), GAP-43 (il, red, white arrow), and counterstained with DAPI (blue) in sham group (a,e,i, n = 5), SCT group (b,f,j, n = 5), NS-miRNA (c,g,k, n = 5) and miR-127 group (d,h,l, n = 5). Three days post operation, TUNEL staining was used to analyze neuronal apoptosis (mp, red, white arrow) in rostral of spinal cord in sham, SCT, NS-miRNA and miR-127 group. Sections were stained with DAPI (blue) to show all nuclei, and TUNEL (red, white arrow) to show apoptotic cells, in merged photomicrographs rose-red were defined as TUNEL positive. (q) The percentage of the NeuN+/DAPI was measured. (r,s) Mean density of CGRP (r) and GAP-43 (s), which presented as IOD/Area in each group were measured. (t) Quantitative histogram showed the percentage of TUNEL/DAPI in sham, SCT, NS-miRNA and miR-127 group. *P < 0.05, **P < 0.01. Scale bar: (a–d), 100 μm; (e–p), 50 μm.
Figure 4
Figure 4. MiR-127 increased neural loss, inhibited axonal regeneration and increased apoptosis of primary cultured spinal neurons.
(a) NeuN immunoreactive staining in normal, NS-miRNA (80 nM), miRNA-127 mimic (80 nM) and anti-miR-127 (100 nM) group. Red signal represented NeuN-positive neurons and blue signal represented nucleus of all cell types. All imaging pictures were taken at 3 days after transfection. (b) Average length of axon in Normal, NS-miRNA, miR-127 mimic and anti-miR-127 group was measured by using Leica AF6000 cell station. Graphs represent the mean ± SEM of quintuplicate culture dishes per group at each time point from three separate experiments. *P < 0.05, **P < 0.01, compared at different time point in the same group. #P < 0.05, ##P < 0.01 compared with the NS-miRNA group at the same time point. (c) Average number of NeuN positive cells per mm2 after being transfected with miR-127 mimic or anti-miR-127 was measured. Graphs represent the mean ± SEM of quintuplicate culture dishes per group at each time point from three separate experiments. *P < 0.05, **P < 0.01, compared at different time point in the same group. #P < 0.05, ##P < 0.01 compared with the NS-miRNA group at the same time point. (d) Representative bright field picture of the primary cultured spinal neurons at 5 days after being transfected with NS-miRNA. (e) TUNEL staining was used to analyze neuronal apoptosis (red fluorescence, white arrow) in normal, NS-miRNA (80 nM), miRNA-127 mimic (80 nM) and anti-miR-127 (100 nM) group at 3 days after transfection. n = 5/group. (f) Percentage of TUNEL/DAPI was shown in normal group, NS-miRNA, miR-127 mimic, and anti-miR-127 group. *P < 0.05, **P < 0.01, compared with the NS-miRNA group. Scale bar: (a,d) 50 μm; (e) 100 μm.
Figure 5
Figure 5. MitoNEET is one of the direct targets of miR-127.
(a) Venn diagram of target genes of miR-127 which derived from conventional online programs of miRDB, TargetScan, miRNAWalk and miRGen. MitoNEET, KCC1 and Spock2 are the common targets of miR-127 in the four conventional online programs which were selected for further investigation. (b) The alignment of the seed regions of miR-127 with MitoNEET, KCC1 and Spock2 3′-UTR. (c) Alignment of the seed regions of miR-127 with MitoNEET and KCC1 3′ UTR, and the mutation of MitoNEET and KCC1 3′ UTR sequence in the complementary site. (d,e,f) 293Tα cells were co-transfected with 80 nM of miR-127 mimic or NS-miRNA and 100 ng/ml of 3′-UTR reporter plasmid of MitoNEET, KCC1 and Spock2 or the relative mutant form. Luciferase activity was detected at 48 h after transfection. Relative luciferase activity was calculated with (Rluc miRNA/hLuc miRNA)/(Rluc NS-miRNA/hLuc NS-miRNA). (g,h) Total RNA of primary spinal neurons was extracted and performed for qRT-PCR of MitoNEET (g) and KCC1 (h) 72 h after being transfected with miR-127 mimic or NS-miRNA. (i,j) The protein expression of MitoNEET (i) and KCC1 (j) in primary spinal neurons was detected by ELISA 72 h after being transfected with miR-127 mimic or NS-miRNA. *P < 0.05, **P < 0.01 compared with NS-miRNA.
Figure 6
Figure 6. The localization of MitoNEET and KCC1 in spinal cord.
(a,b) Double-label fluorescence detection of NeuN/MitoNEET (a) and NeuN/KCC1 (b) were carried out in spinal cord. Sections were stained with DAPI (a,b, blue, the first panel) to show all nuclei, NenN (a,b, green, the second panel), MitoNEET (a, red, the third panel), KCC1 (b, red, the third panel), and the merge image (a,b, the last panel). The merge image shows the region of co-localization appearing yellow. (c,d) Double-label fluorescence detection of GFAP/MitoNEET (c) and GFAP/KCC1 (d) were carried out in spinal cord. Sections were stained with DAPI (c,d, blue, the first panel) to show all nuclei, GFAP (c,d, green, the second panel), MitoNEET (c, red, the third panel), KCC1 (d, red, the third panel), and the merge image (c,d, the last panel). The merge image shows the region of co-localization appearing yellow. Scale bar: (a–d) 50 μm.
Figure 7
Figure 7. si-MitoNEET increased neural losses, inhibited axonal regeneration, and promoted neural apoptosis.
(a) Transfected Cy3-5′-si-MitoNEET with red fluorescence was observed in primary spinal neurons at 48 h after transfection. (b) Total RNA of primary cultured spinal neurons was extracted and qRT-PCR of MitoNEET was performed in normal, NS-siRNA (100 nM) and si-MitoNEET (100 nM) group 72 h after transfection. (c) Representative bright field picture of the primary cultured spinal neurons 5 days after transfection with NS-siRNA. (d) Average length of axon spinal neurons was measured by using Leica AF6000 cell station. Data are presented as the means ± SEM. *P < 0.05, **P < 0.01, compared at different time point in the same group. #P < 0.05, ##P < 0.01 compared with the NS-siRNA group at the same time point. (e) Immunostaining of NeuN in normal, NS-siRNA (100 nM) and si-MitoNEET (100 nM) group was performed 3 days after the transfection. Green signal represented NeuN-positive neuron and blue signal represented nucleus of all cell types (left). And average number of NeuN positive cells per mm2 was measured (right). (f) Immunofluorescence staining of GAP-43 (red, left) in normal, NS-siRNA and si-MitoNEET group was performed. DAPI (blue) was employed to show all nuclei. Mean density of GAP-43, which presented as IOD/Area in each group was measured (right). (g) TUNEL staining (white arrow) was performed in normal, NS-siRNA (100 nM) and si-MitoNEET (100 nM) group at 3 days after transfection. DAPI (blue) was used to show all nuclei. The percent of TUNEL/DAPI was evaluated and indicated by quantitative histogram (right). *P < 0.05, **P < 0.01, compared with NS-siRNA. Scale bar: (a,c) 50 μm; (eg) 100 μm.

References

    1. Tederko P., Krasuski M., Kiwerski J., Nyka I. & Bialoszewski D. Strategies for neuroprotection following spinal cord injury.Ortopedia, traumatologia, rehabilitacja. 11, 103–110 (2009). - PubMed
    1. Bareyre F. M. & Schwab M. E. Inflammation, degeneration and regeneration in the injured spinal cord: insights from DNA microarrays. TRENDS NEUROSCI. 26, 555–563, doi: 10.1016/j.tins.2003.08.004 (2003). - DOI - PubMed
    1. Profyris C. et al. Degenerative and regenerative mechanisms governing spinal cord injury. NEUROBIOL DIS. 15, 415–436, doi: 10.1016/j.nbd.2003.11.015 (2004). - DOI - PubMed
    1. Alexander J. K. & Popovich P. G. Neuroinflammation in spinal cord injury: therapeutic targets for neuroprotection and regeneration. PROG BRAIN RES. 175, 125–137, doi: 10.1016/s0079-6123(09)17508-8 (2009). - DOI - PubMed
    1. Beattie M. S. Inflammation and apoptosis: linked therapeutic targets in spinal cord injury. TRENDS MOL MED. 10, 580–583, doi: 10.1016/j.molmed.2004.10.006 (2004). - DOI - PubMed

Publication types

MeSH terms