

Sensitivity Analyses for Robust Causal Inference from Mendelian Randomization Analyses with Multiple Genetic Variants
- PMID: 27749700
- PMCID: PMC5133381
- DOI: 10.1097/EDE.0000000000000559
Sensitivity Analyses for Robust Causal Inference from Mendelian Randomization Analyses with Multiple Genetic Variants
Abstract
Mendelian randomization investigations are becoming more powerful and simpler to perform, due to the increasing size and coverage of genome-wide association studies and the increasing availability of summarized data on genetic associations with risk factors and disease outcomes. However, when using multiple genetic variants from different gene regions in a Mendelian randomization analysis, it is highly implausible that all the genetic variants satisfy the instrumental variable assumptions. This means that a simple instrumental variable analysis alone should not be relied on to give a causal conclusion. In this article, we discuss a range of sensitivity analyses that will either support or question the validity of causal inference from a Mendelian randomization analysis with multiple genetic variants. We focus on sensitivity analyses of greatest practical relevance for ensuring robust causal inferences, and those that can be undertaken using summarized data. Aside from cases in which the justification of the instrumental variable assumptions is supported by strong biological understanding, a Mendelian randomization analysis in which no assessment of the robustness of the findings to violations of the instrumental variable assumptions has been made should be viewed as speculative and incomplete. In particular, Mendelian randomization investigations with large numbers of genetic variants without such sensitivity analyses should be treated with skepticism.
Conflict of interest statement
Conflicts of Interest: None declared.
Figures
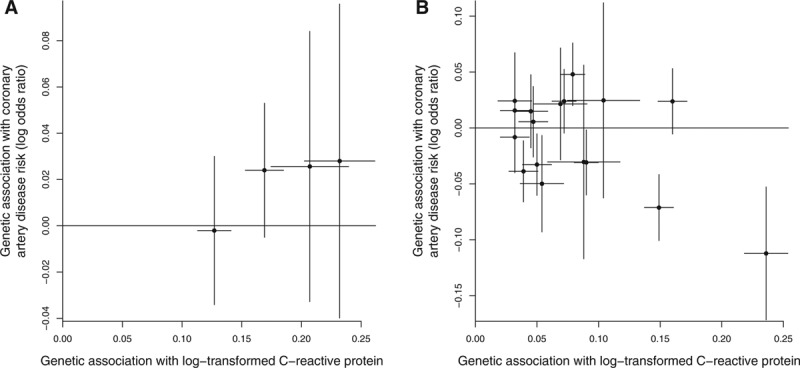
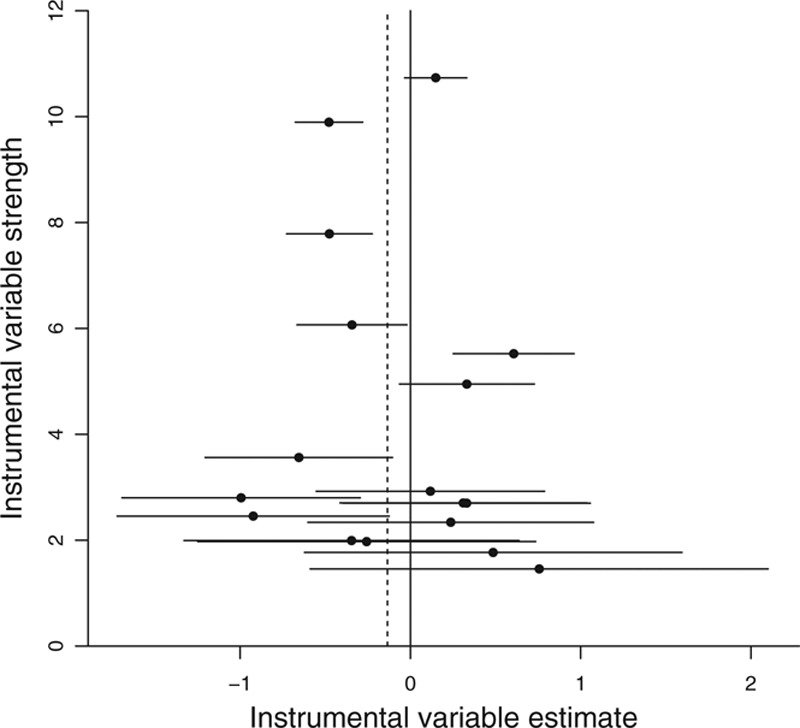
 against instrumental variable estimates for each genetic variant separately
  for Mendelian randomization analysis of C-reactive protein on coronary artery disease risk using genetic variants throughout the genome that have been demonstrated as associated with C-reactive protein at a genome-wide level of significance. Horizontal lines represent 95% confidence intervals for the instrumental variable estimates. Solid vertical line is at the null; dashed vertical line is the (fixed-effect) inverse-variance weighted estimate.
Comment in
-
Commentary: Can We See the Forest for the IVs?: Mendelian Randomization Studies with Multiple Genetic Variants.Epidemiology. 2017 Jan;28(1):43-46. doi: 10.1097/EDE.0000000000000558. Epidemiology. 2017. PMID: 27662595 No abstract available.
References
-
- Martens EP, Pestman WR, de Boer A, Belitser SV, Klungel OH. Instrumental variables: application and limitations. Epidemiology. 2006;17:260–267. - PubMed
-
- Hernán MA, Robins JM. Instruments for causal inference: an epidemiologist’s dream? Epidemiology. 2006;17:360–372. - PubMed
-
- Davey Smith G, Ebrahim S. ‘Mendelian randomization’: can genetic epidemiology contribute to understanding environmental determinants of disease? Int J Epidemiol. 2003;32:1–22. - PubMed
-
- Burgess S, Thompson SG. Mendelian Randomization: Methods for Using Genetic Variants in Causal Estimation. Boca Raton, FL: Chapman & Hall; 2015.
-
- Didelez V, Sheehan N. Mendelian randomization as an instrumental variable approach to causal inference. Stat Methods Med Res. 2007;16:309–330. - PubMed
Publication types
MeSH terms
Substances
Grants and funding
LinkOut - more resources
Full Text Sources
Other Literature Sources
