

doi: 10.1038/nn.4414.
Epub 2016 Oct 17.
Antagonistic negative and positive neurons of the basolateral amygdala
Affiliations
- PMID: 27749826
- PMCID: PMC5493320
- DOI: 10.1038/nn.4414
Item in Clipboard
Antagonistic negative and positive neurons of the basolateral amygdala
Nat Neurosci.
2016 Dec.
Abstract
The basolateral amygdala (BLA) is a site of convergence of negative and positive stimuli and is critical for emotional behaviors and associations. However, the neural substrate for negative and positive behaviors and relationship between negative and positive representations in the basolateral amygdala are unknown. Here we identify two genetically distinct, spatially segregated populations of excitatory neurons in the mouse BLA that participate in valence-specific behaviors and are connected through mutual inhibition. These results identify a genetically defined neural circuit for the antagonistic control of emotional behaviors and memories.
Figures
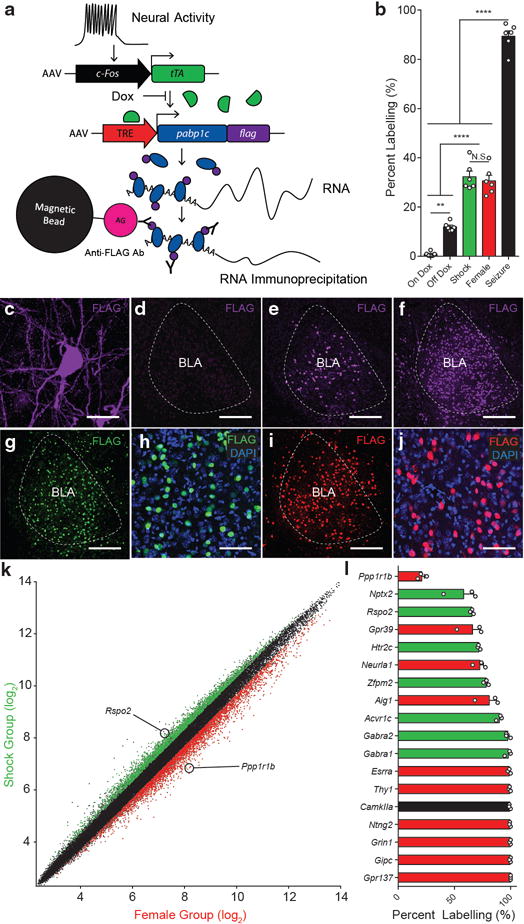
a, Viral-based genetic scheme for activity-dependent transcriptional profiling. c-Fos promoter activity drives the expression of tTA, which in turn, binds TRE and drives the expression of PABP-FLAG in the absence of doxycycline (Dox). b, PABP-FLAG expression in the BLA in mice kept on a Dox diet (On Dox), taken off a Dox diet and exposed to home cage (Off Dox), Shock, Female, Seizure, (one-way ANOVA, F4,25=131.0, P<0.0001, n = 6 per group). Significance for multiple comparisons, **P < 0.01, ****P < 0.0001, not significant (N.S.). c, PABP-FLAG expression in soma and varicosities of a BLA neuron. FLAG expression in the BLA of On Dox (d), Off Dox (e), Seizure (f), Shock (g,h), and Female (i,j) group. FLAG expression and nuclear marker, DAPI, in Shock (h), and Female (j) group. Scale bar 25μm (c), 250μm (d,e,f,g,i), 80 μm (h,j). k, RMA normalizedn RNA expression values from microarray from RNA purified from Shock (n = 3) and Female (n = 3) groups. Red and green points represent enriched genes (>1.25 fold, ANOVA p<.05, log2 scale). l, Quantification of in situ hybridization of BLA expression of candidate genetic markers enriched in shock group (green) and female group (red) (n = 3 mice per group). Positive control genes (black). Results show mean ± s.e.m (b,l).
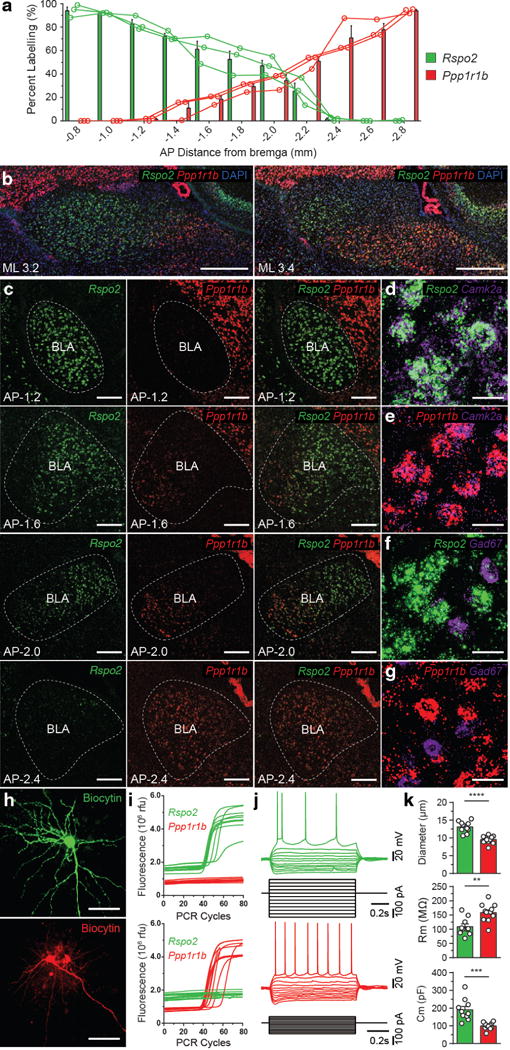
a, Quantification of smFISH of Rspo2 (green) and Ppp1r1b (red) expression across the AP axis (coronal distance from bregma −0.8mm to −2.8mm) of the BLA, bars represent means, line represents individual mice (n = 3). b, Two sagittal views (ML distance from midline, 3.2mm, 3.4mm) of double smFISH of Rspo2 and Ppp1r1b with nuclear marker, DAPI, in the BLA c, Coronal view of double smFISH of Rspo2 and Ppp1r1b across the AP axis of the BLA. Double smFISH of Camk2a and Rspo2 (d), Camk2a and Ppp1r1b (e), Gad1 and Rspo2 (f) Gad1 and Ppp1r1b (g), in the BLA (Larger micrograph in Supplemental Fig. 3). Scale bar 500μm (b), 200μm (c), 25μm (d–g). h, Biocytin-filled magnocellular (top) and parvocellular (bottom) BLA neuron, scale bar 50μm. i, Single-cell qPCR traces of Rpso2 (green) and Ppp1r1b (red), of magnocellular (top) and parvocellular (bottom) BLA neurons, qPCR traces in which amplification occurred for either gene is shown. j, Electrophysiological response to current steps in a Rspo2+ (top) and Ppp1r1b+ (bottom) BLA neuron. k, Comparison of mean soma diameter, membrane resistance (Rm), and membrane capacitance (Cm) of qPCR-confirmed Rpso2+ (green, n = 11) and Ppp1r1b+ (red, n = 12) neurons. Significance for unpaired t-test, **P< 0.01, ***P<0 .001, ****P<0.0001. Results show mean ± s.e.m (a,k).
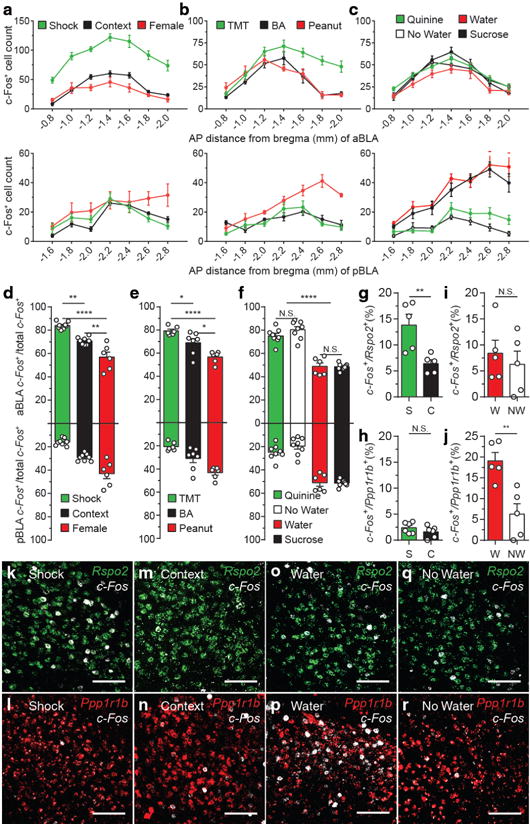
c-Fos expression across the AP axis (coronal distance from bregma −0.8mm to −2.8mm) of the aBLA (top) and pBLA (bottom) in response to shock (n = 8), context (n = 8), female (n = 6) (a); TMT (n = 6), BA (n = 7), peanut oil (n = 6) (b); quinine water (n = 8), no water (n = 8), water (n = 6), sucrose water (n = 8) (c). The total number of c-Fos+ cells is represented for each coronal section of a unilateral BLA (a–c), micrographs found in Supplemental Fig. 4. d, Relative c-Fos expression in the aBLA and pBLA in response to shock, context, female (one-way ANOVA, F2,19=33.91, P<0.0001). e, Relative c-Fos expression in response to TMT, BA, peanut oil (one-way ANOVA, F2,16=16.61, P=0.0001,). f, Relative c-Fos expression in response to quinine water, no water, water, sucrose water (one-way ANOVA, F2,19=33.91, P<.0001). Significance for multiple comparisons (d–f), *P < 0.05, **P < 0.01, ****P < 0.0001, not significant (N.S.). Double-label smFISH (n = 5 in each group) of c-Fos/Rspo2+ (g,k,m) or c-Fos/Ppp1r1b+ (h,l,n) in response to shock (S) or context (C). Double-label smFISH of c-Fos/Rspo2+ (i,o,q) or c-Fos/Ppp1r1b+ (j,p,r) in response to water (W) or no water (NW) (AP axis analysis in Supplemental Fig. 5), y-axis values denote percentage. Significance for unpaired t-test (g–j), **P<0.01, not significant (N.S). Scale bar 125μm (k–r). Results show mean ± s.e.m (a–j). Color scheme corresponds to the valence of the stimuli negative (green) and positive (red) (a–j), Rpso2(green) and Ppp1r1b(red) (k–r).
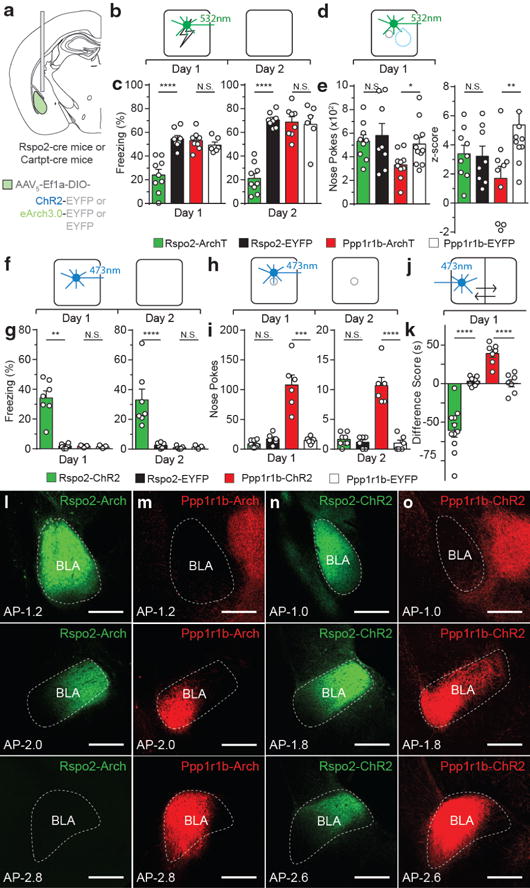
a, Optogenetically targeting Rspo2+ and Ppp1r1b+ BLA neurons. Scheme and results for Rspo2-Arch and Ppp1r1b-Arch mice in a fear (b,c) and reward (d,e) conditioning. c, Rspo2-Arch mice (n = 9) displayed lower freezing on Day 1 and 2 compared to eYFP controls (n = 8), no difference between Ppp1r1b-Arch (n = 8) and Ppp1r1b-eYFP (n = 6) mice. e, Ppp1r1b-Arch mice (n = 10) displayed lower total nose pokes and cue-reward association in nose port (z-score) compared to eYFP controls (n = 11), no difference between Rspo2-Arch (n = 9) and Rspo2-eYFP (n = 8). Scheme and results for Rspo2-ChR2 and Ppp1r1b-ChR2 mice in an optogenetic freezing test (f,g), optogenetic self-stimulation test (h,i), and optogenetic place preference test (j,k). g, Rspo2-ChR2 mice (n = 7) displayed greater freezing levels on Day 1 and 2 compared to eYFP controls (n = 6), no difference between Ppp1r1b-ChR2 (n = 5) and Ppp1r1b-eYFP (n =5) mice. i, Ppp1r1b-ChR2 mice (n = 6) displayed greater levels of nose pokes on day 1 and 2 compared to EYFP controls (n = 6), no difference between Rspo2-ChR2 (n = 8) and Rspo2-eYFP (n = 6) mice. k, Rspo2-ChR2 mice (n = 11) displayed greater preference to light stimulation compared to eYFP controls (n = 8), while Ppp1r1b-ChR2 (n = 7) mice displayed greater preference to light stimulation compared to eYFP controls (n = 7). Significance for unpaired t-test between experimental groups compared to corresponding eYFP controls, *P< 0.05, **P< 0.01, ***P<0 .001, ****P<00001, not significant (N.S), results show mean ± s.e.m (c,e,g,i,k). Expression of eArch-EYFP in Rspo2-Arch mice (l) and Ppp1r1b-Arch mice (m). Expression of ChR2-EYFPin Rspo2-ChR2 mice (n) and Ppp1r1b-ChR2 mice (o). Strong Ppp1r1b+ fibers are found in the central amygdala (m,o). Scale bar, 300μm (l,m,n,o). Color scheme corresponds to the virus-infected transgenic mouse, Rpso2-Cre (green) and Cartpt-Cre (red) (c,e,g,i,k,l–o).
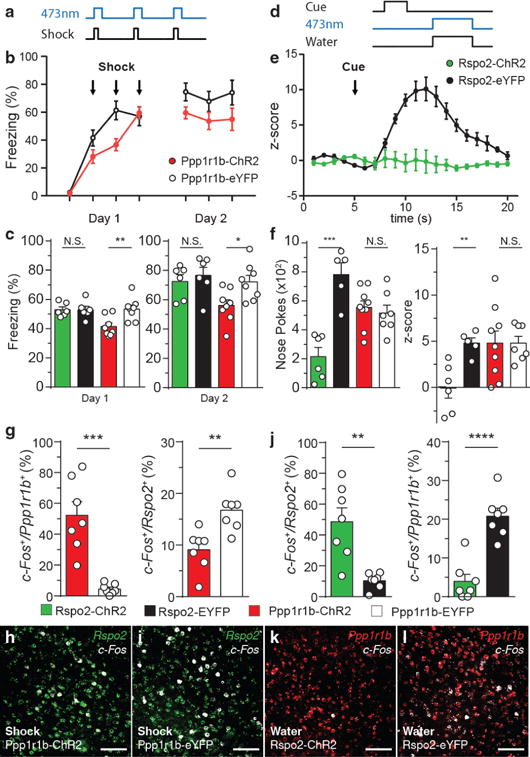
a, Scheme of activation of BLA neurons in Rspo2-ChR2 and Ppp1r1b-ChR2 mice during shocks (Day 1). b, Time course of freezing during day 1 and day 2 in Ppp1r1b-ChR2 (n = 8) and Ppp1r1b-eYFP (n = 8) mice. c, On day 1 and day 2, Ppp1r1b-ChR2 (n = 8) displayed lower freezing levels compared to eYFP controls (n =8), no difference between Rspo2-ChR2 (n = 6) and Rspo2-eYFP (n = 6) mice. d, Scheme of activation of BLA neurons in Rspo2-ChR2 and Ppp1r1b-ChR2 mice during reward conditioning. e, Time course of z-score of poking in Rspo2-ChR2 (n = 6) and Rspo2-eYFP (n = 5) mice. f, Rspo2-ChR2 mice (n = 6) displayed lower total nose pokes and cue-reward association compared to eYFP controls (n = 5), no difference between Ppp1r1b-ChR2 (n = 9) and Ppp1r1b-eYFP (n = 7) mice. Significance for unpaired t-test between experimental groups compared to corresponding eYFP controls, *P< 0.05, **P< 0.01, ***P<0 .001, ****P<0.0001, not significant (N.S), results show mean ± s.e.m. g,h,i Quantification of smFISH of c-Fos in Ppp1r1b+and Rpso2+ neurons in Ppp1r1b-ChR2 and Ppp1r1b-eYFP mice that received shock simultaneously with blue light stimulation. j,k,l, Quantification of smFISH of c-Fos in Rspo2+and Ppp1r1b+ neurons in Rspo2-ChR2 and Rspo2-eYFP mice that received water simultaneously with blue light stimulation. Significance for unpaired t-test (g,j), **P< 0.01, ***P<0 .001, ****P<0.0001, not significant (N.S). Results show mean ± s.e.m. Scale bar, 300μm (h,i,k,l). Color scheme corresponds to the virus-infected transgenic mouse, Rpso2-Cre (green) and Cartpt-Cre (red) (b,c,e,f,g,j) or valence of stimuli negative (green) and positive (red or white) (h,i,k,l).
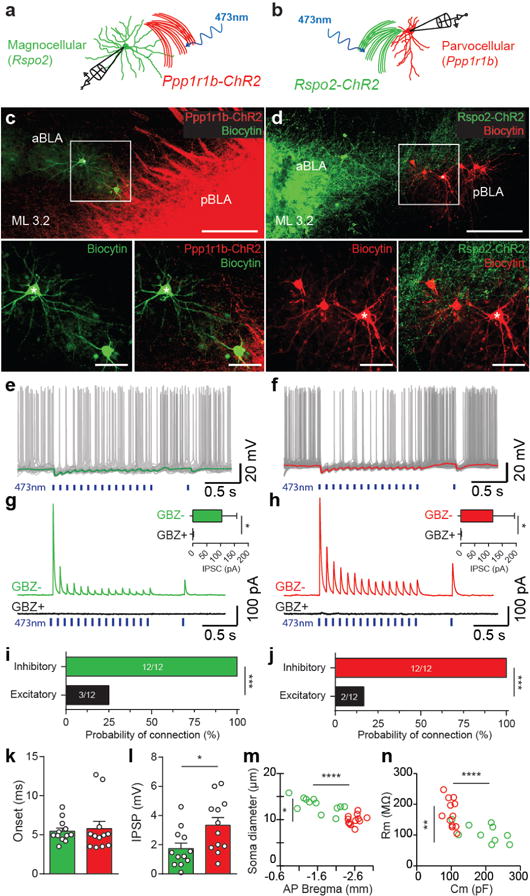
a,b, Scheme for the experimental setup for recording in magnocellular (Rspo2+) (a) and parvocellular (Ppp1r1b+) (b) neurons, while stimulating Ppp1r1b+ (Ppp1r1b-ChR2 mice) and Rpso2+ (Rspo2-ChR2 mice) neurons, respectively. c,d, Sagittal view of biocytin-filled Rspo2+ BLA neurons in Ppp1r1b-ChR2 mice (c) and Ppp1r1b+ BLA neurons in Rspo2-ChR2 mice (d). Scale bar 200μm, inset: 50 μm (c,d). AsterisksA denotes the electrophysiological traces in e and f.f Inhibitory postsynaptic potentials (IPSPsP) recorded in Rspo2+ (e) and Ppp1r1b+ (f) BLA neurons by 10Hz optogenetic stimulation of Ppp1r1b-ChR2 (e) and Rspo2-ChR2 (f) fibers. Green.G (e) and red (f) traces represent average trace of 20 sweeps recorded during periods without spikes. Inhibitory postsynaptic currents (IPSCs) recorded in Rpso2+ (magnocellular) (g) and Ppp1r1b+ (parvocellular) (h) BLA neurons (clamped at 0 mV) in response to optogenetic stimulation (10Hz train) of Ppp1r1b-ChR2 (g) and Rspo2-ChR2 (h) fibers. Currents are blocked by bath application of gabazine (GBZ, 10 μM), insets: IPSCs amplitude before (GBZ-) and after GBZ (GBZ+) application (for both magnocellular (n = 6) (g) and parvocellular (n = 6) (h), Wilcoxon signed-rank test, *P < 0.05. Probability of connection, Ppp1r1b+ to Rspo2+ connection (i) and Rspo2+ to Ppp1r1b+ connection (j). The two groups interact predominately by mutual inhibition rather than excitation, Fisher exact test, ***P <0.001 (i,j). IPSC onset in Rspo2+ (green) and Ppp1r1b+ (red) neurons were similar (k). IPSC amplitude was greater in Ppp1r1b+ (red) than in Rspo2+ (green) neurons (l), unpaired t-test *P<0.05. Recorded magnocellular (green) and parvocellular (red) neurons were confirmed using soma diameter and anatomical position (m); membrane resistance (Rm) and membrane capacitance (Cm) (n). Rspo2+ and Ppp1r1b+ cells were statistically distinct in all four parameters and consistent with values characterized in Fig. 2, significance for unpaired t-test *P<0.05, **P<0.01, ****P<0.0001 (n, m). Results show mean ± s.e.m (g,h,,k,l). Color scheme corresponds to the neurons recorded or virus-infected transgenic mouse, Rpso2+ neurons or Rpso2-Cre (green) and Ppp1r1b+ neurons or Cartpt-Cre (red) (a–n).
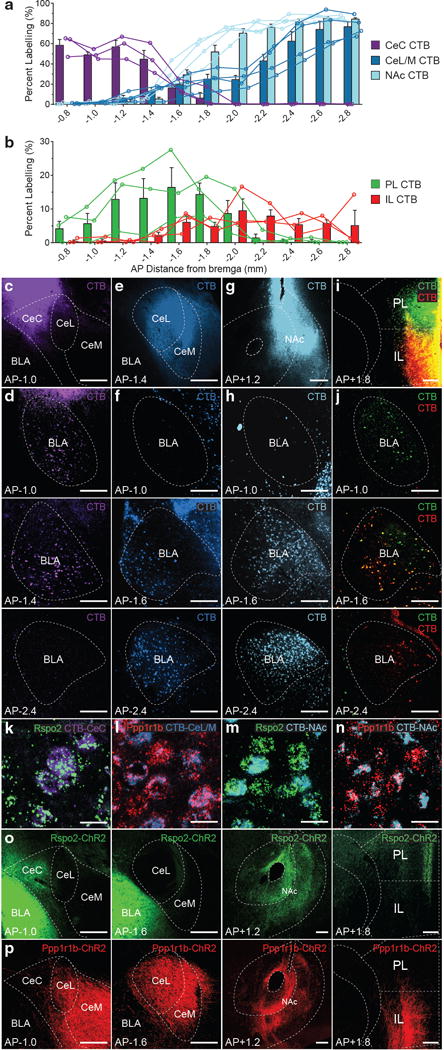
Quantification of CTB+ neurons across the AP axis (coronal distance from bregma −0.8mm to −2.8mm) of the BLA from CTB targeted to the amygdala and supplemental amygdala areas (a)—CeC (c,d), CeL/CeM (e,f), NAc (g,h), or dual CTB targeted to prefrontal cortex (b)—PL and IL (i,j) (bar represent mean, lines represent individual mice, n = 3 mice per group). Injections site of CTB (c,e,g,i) and CTB+ BLA neurons (d,f,h,j). Co-labelling of Rspo2 mRNA in the BLA with CTB targeted to the CeC (k) and NAc (m). Co-labelling of Ppp1r1b mRNA in the BLA with CTB injected into the CeL/CeM (l) and NAc (n), quantification in Table 1, micrographs in Supplemental Fig.7. Rspo2-ChR2+ fibers are found in the CeC, NAc, and PL (o). Ppp1r1b-ChR2+ fibers are found in the CeL, CeM, NAc, and IL (p). Scale bar 250 μm (c-j,o,p), 25 μm(k–n). Results show mean ± s.e.m. Color scheme corresponds to the virus-infected transgenic mouse, Rpso2-Cre (green) and Cartpt-Cre (red) (o,p).
References
-
- Pitkanen A, Savander V, LeDoux JE. Organization of intra-amygdaloid circuitries in the rat: an emerging framework for understanding functions of the amygdala. Trends in neurosciences. 1997;20:517–523. - PubMed
-
- McDonald AJ. Neuronal organization of the lateral and basolateral amygdaloid nuclei in the rat. The Journal of comparative neurology. 1984;222:589–606. - PubMed
-
- Swanson LW, Petrovich GD. What is the amygdala? Trends in neurosciences. 1998;21:323–331. - PubMed
-
- Hall E. The amygdala of the cat: a Golgi study. Zeitschrift fur Zellforschung und mikroskopische Anatomie. 1972;134:439–458. - PubMed
-
- McDonald AJ. Neurons of the lateral and basolateral amygdaloid nuclei: a Golgi study in the rat. The Journal of comparative neurology. 1982;212:293–312. - PubMed
MeSH terms
Grants and funding
LinkOut - more resources
Full Text Sources
Other Literature Sources
Molecular Biology Databases
