. 2016 Dec;13(12):1013-1020.
doi: 10.1038/nmeth.4031. Epub 2016 Oct 17.

ATAC-see reveals the accessible genome by transposase-mediated imaging and sequencing

Affiliations

ATAC-see reveals the accessible genome by transposase-mediated imaging and sequencing

Xingqi Chen et al. Nat Methods. 2016 Dec.

Abstract

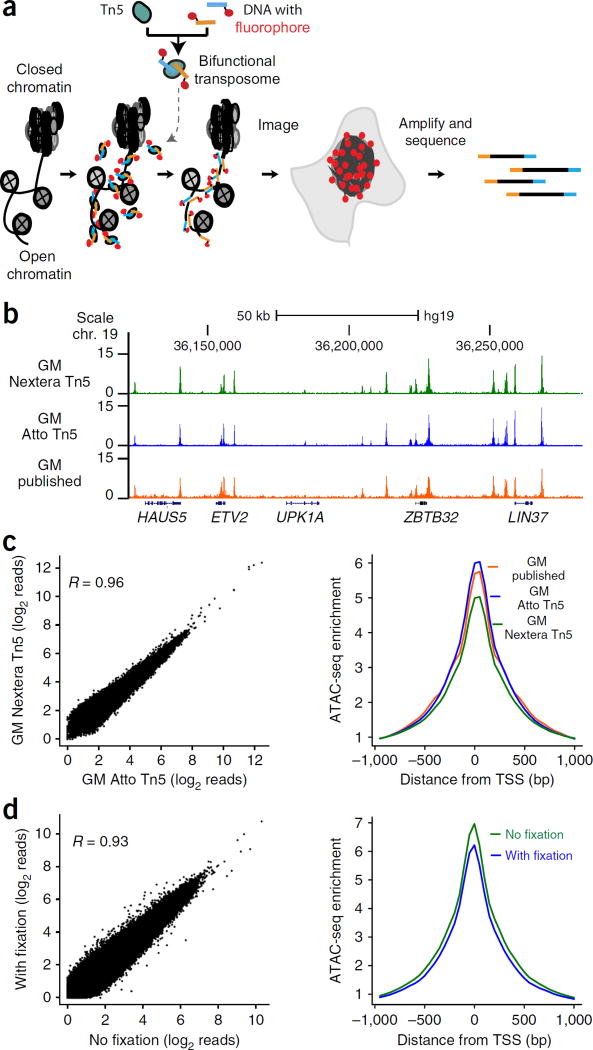
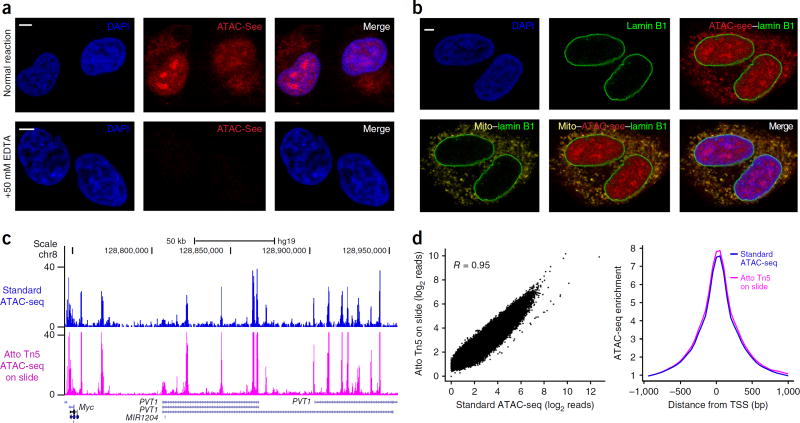
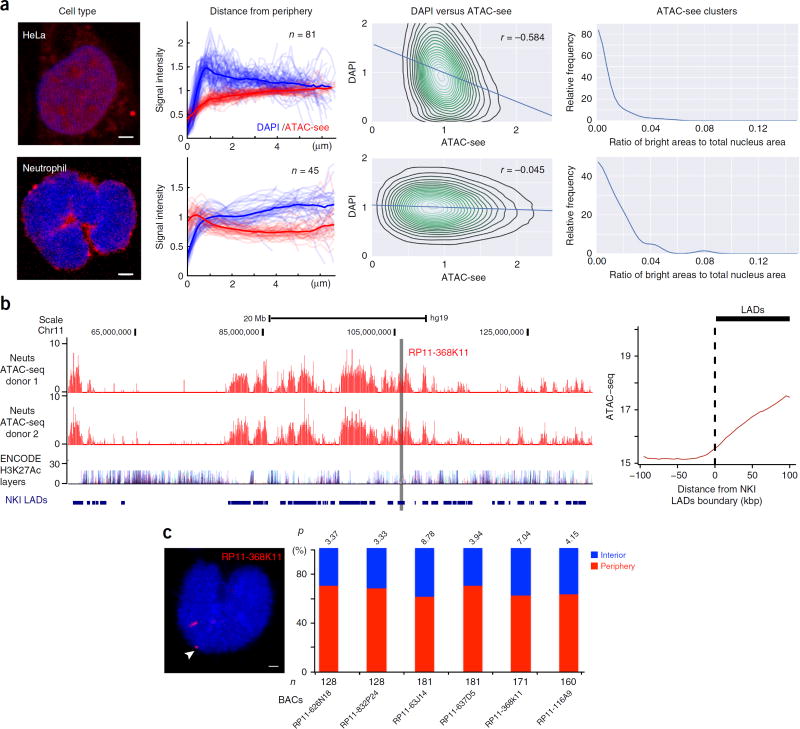
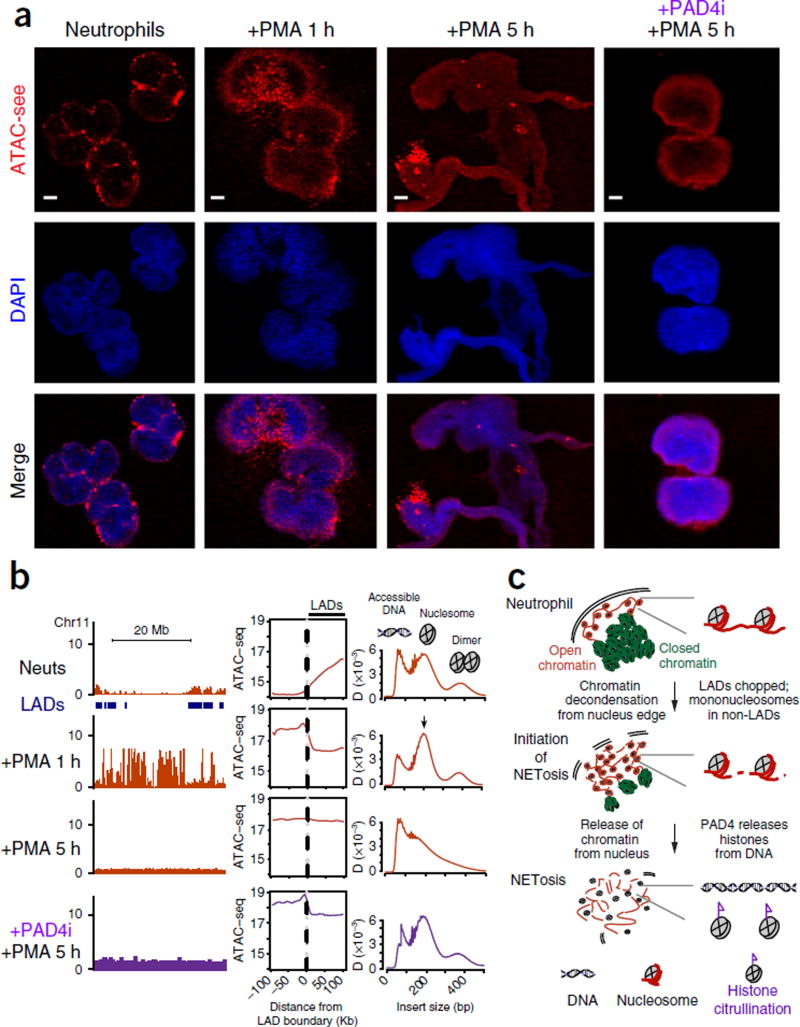
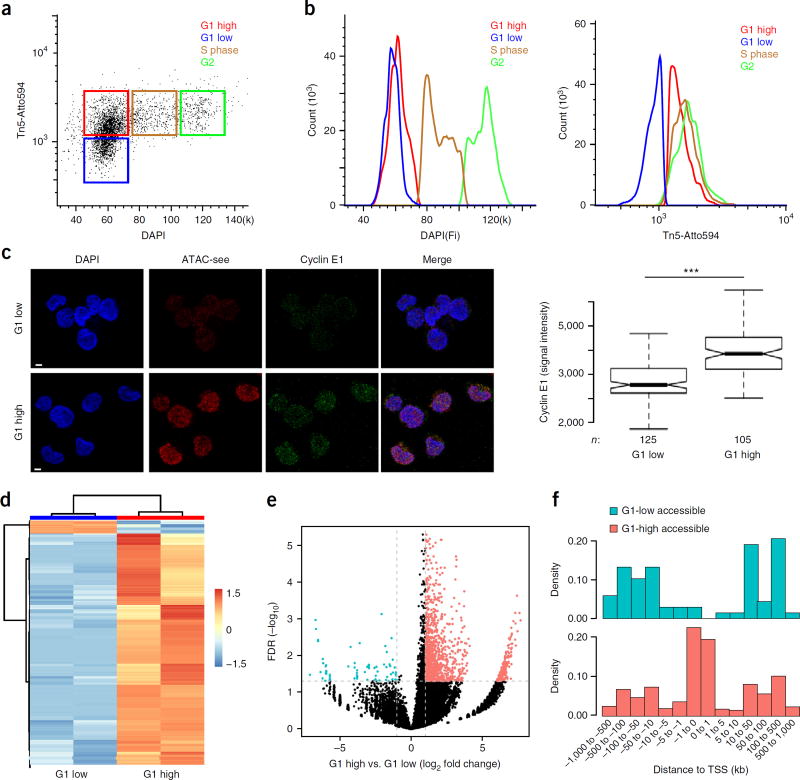
Spatial organization of the genome plays a central role in gene expression, DNA replication, and repair. But current epigenomic approaches largely map DNA regulatory elements outside of the native context of the nucleus. Here we report assay of transposase-accessible chromatin with visualization (ATAC-see), a transposase-mediated imaging technology that employs direct imaging of the accessible genome in situ, cell sorting, and deep sequencing to reveal the identity of the imaged elements. ATAC-see revealed the cell-type-specific spatial organization of the accessible genome and the coordinated process of neutrophil chromatin extrusion, termed NETosis. Integration of ATAC-see with flow cytometry enables automated quantitation and prospective cell isolation as a function of chromatin accessibility, and it reveals a cell-cycle dependence of chromatin accessibility that is especially dynamic in G1 phase. The integration of imaging and epigenomics provides a general and scalable approach for deciphering the spatiotemporal architecture of gene control.


Conflict of interest statement

COMPETING FINANCIAL INTERESTS

The authors declare competing financial interests: details are available in the online version of the paper.

Figures

Figure 1
Figure 1
ATAC-see visualizes the accessible genome in situ. (a) Schematic of ATAC-see. (b) Genome browser tracks of ATAC-seq libraries from GM12878 cells (GM) generated by using different Tn5 transposases: green, Nextera Tn5; blue, Atto Tn5; orange, previously published data. A 50-kb scale bar and genome locations are indicated at the top of the tracks; gene names (HAUS5, etc.) are shown at the bottom. Chr, chromosome; hg19, human genome. (c) Left panel, genome-wide comparison of ATAC-seq reads of GM12878 libraries (GM) prepared by using either Nextera Tn5 or Atto Tn5. Right panel, TSS enrichment of GM12878 ATAC-seq libraries transposed with different Tn5. Green, Nextera Tn5; blue, Atto Tn5; orange, previously published data. (d) Genome-wide comparison of ATAC-seq reads of HT1080 library prepared with or without fixation. Left, scatter plot of all data points; right, metagene analysis centered on transcriptional start sites (TSS).
Figure 2
Figure 2
ATAC-see enables imaging and sequencing of the accessible genome in the same cells. (a) Representative image of ATAC-see result in HT1080 cells. Very limited ATAC-see signal is observed in +EDTA negative control (quantified in supplementary Fig. 3a). Merge, merged image of DAPI and ATAC-see. Scale bars, 2 µm. (b) Multimodal imaging combining ATAC-see with immunofluorescence. The representative images employ costaining with nucleus lamin B1 and/or mitochondrial protein marker (Mito) to show ATAC-see signals overlapping with mitochondria outside of the nucleus. Scale bar, 2 µm. (c) Genomic tracks of ATAC-seq data from standard protocol and Atto-Tn5 on slide after imaging. x-axis, genomic coordinates; y-axis, normalized ATAC-seq read counts. 50-kb scale bar and genome locations are indicated at the top; gene names (Myc, etc.) are shown at the bottom. Chr, chromosome; hg19, human genome. (d) Genome-wide comparisons of standard ATAC-seq data with Atto Tn5 on-slide data after imaging. Left, scatter plot of all data points; right, metagene analysis centered on transcriptional start sites (TSS).
Figure 3
Figure 3
Cell-type-specific accessible-chromatin organization in the intact nucleus. (a) Image analysis. For each cell type (organized in rows), we display four columns (i–iv, left to right): (i) a representative ATAC-see image (red, ATAC-see; blue, DAPI; scale bar, 2 µm); (ii) signal intensity of ATAC-see and DAPI as a function of distance from nuclear periphery. Each trace is one nucleus, and n = number of nuclei analyzed; (iii) correlation of ATAC-see and DAPI signal intensity. Pearson correlation (r) is indicated; (iv) ATAC-see clusters, quantified as the ratio of ATAC-see bright areas versus the total nucleus area. (b) Unique feature of ATAC-seq from human neutrophil (Neuts) after imaging. Left, genome browser track of ATAC-seq in human neutrophil, H3K27Ac layer from ENCODE 7 cell lines, and lamin-associated domains (LADs) published by the Netherlands Cancer Institute (NKI). x-axis, genomic coordinates; y-axis, ATAC-seq-normalized read counts. The gray line indicates the location of bacterial artifical chromosome (BAC) chosen for DNA FISH in c. Right, metagene plot of human neutrophil ATAC-seq signal centered on the boundary between NKI LADs and neighboring sequences. The dashed black line indicates the boundary of LADs, and the thick black line on the top of the graph presents the distance to LADs boundary. (c) Left, example of DNA FISH from indicated BAC (in b) in human neutrophil; the white arrow indicates the FISH signal (red) at the neutrophil periphery. Right, location quantification of DNA FISH signal (percentage in y-axis) from the indicated BACs (x-axis) in the human neutriophil. The nucleus periphery was defined as a distance between DNA FISH signal to DAPI staining edge <0.1 µm (see Online Methods). n, number of alleles counted in DNA FISH. P values were calculated by a binomial test.
Figure 4
Figure 4
ATAC-see and ATAC-seq reveal the dynamic chromatin organization during human NETosis. DAPI, stain used to stain the nucleus; merge, merged image of DAPI and ATAC-see. (a) Representative ATAC-see images in the indicated conditions. PMA stimulation timecourse, PAD4 inhibitor treatment (PAD4i). Scale bars, 2 µm. (b) Epigenomic landscape of NETosis. Left column, genomic tracks of ATAC-seq data from the indicated conditions. Locations of NKI lamin-associated domains (LADs) are indicated. The x-axis represents genomic coordinates; the y-axis represents ATAC-seq normalized read counts. Middle column, metagene plot of ATAC-seq signal centered on the boundary between NKI LADs and neighboring sequences. The top plot is the same as the right panel in Figure 3b and is reproduced here for clarity as the baseline in this timecourse. Right column, ATAC-seq insert size distribution for the corresponding samples. Diagnostic insert sizes for accessible DNA, mononucleosome, and dinucleosome are labeled. (c) Proposed model of NETosis illustrates the coordinated dynamics of nuclear architecture, accessible genome reorganization, and genome disassembly.
Figure 5
Figure 5
ATAC-see reveals cell-cycle-specific genome accessibility. (a) Flow cytometry with ATAC-see. Dot plot of signal intensity in dual staining for DAPI and ATAC-see of GM12878 cells; results showed four groups of cells: G1 low, G1 high, S phase, and G2. (b) Quantitation of DAPI (left) and ATAC-see (right) signals from different groups. (c) Cyclin E1 staining in ATAC-see-sorted G1-high and G1-low cells. Left panel, representative images from confocal microscopy. Scale bars, 2 µm. Right panel is a box plot depicting signal intensity measurement. n, cell number; ***, P < 0.001, Student t-test. (d) Heatmap shows cluster of different ATAC-seq accessible regions between the G1-high and G1-low cells (FD > 2, FDR < 0.05); each group has one replicate. (e) The volcano plot represents genome-wide comparisons of accessible regions in G1-high versus G1-low cells. (f) The density histograms represent the distribution of the more accessible regions in G1-high and G1-low cells across the transcription starting sites (TSS). The more accessible regions in the two groups were color coded.

References

    1. Bickmore WA, van Steensel B. Genome architecture: domain organization of interphase chromosomes. Cell. 2013;152:1270–1284. - PubMed
    1. Misteli T. Self-organization in the genome. Proc. Natl. Acad. Sci. USA. 2009;106:6885–6886. - PMC - PubMed
    1. Buenrostro JD, Giresi PG, Zaba LC, Chang HY, Greenleaf WJ. Transposition of native chromatin for fast and sensitive epigenomic profiling of open chromatin, DNA-binding proteins and nucleosome position. Nat. Methods. 2013;10:1213–1218. - PMC - PubMed
    1. Fullwood MJ, et al. An oestrogen-receptor-alpha-bound human chromatin interactome. Nature. 2009;462:58–64. - PMC - PubMed
    1. Barski A, et al. High-resolution profiling of histone methylations in the human genome. Cell. 2007;129:823–837. - PubMed

MeSH terms