. 2016 Dec;48(12):1500-1507.
doi: 10.1038/ng.3683. Epub 2016 Oct 17.

Spatial intratumoral heterogeneity and temporal clonal evolution in esophageal squamous cell carcinoma

Affiliations

Spatial intratumoral heterogeneity and temporal clonal evolution in esophageal squamous cell carcinoma

Jia-Jie Hao et al. Nat Genet. 2016 Dec.

Abstract

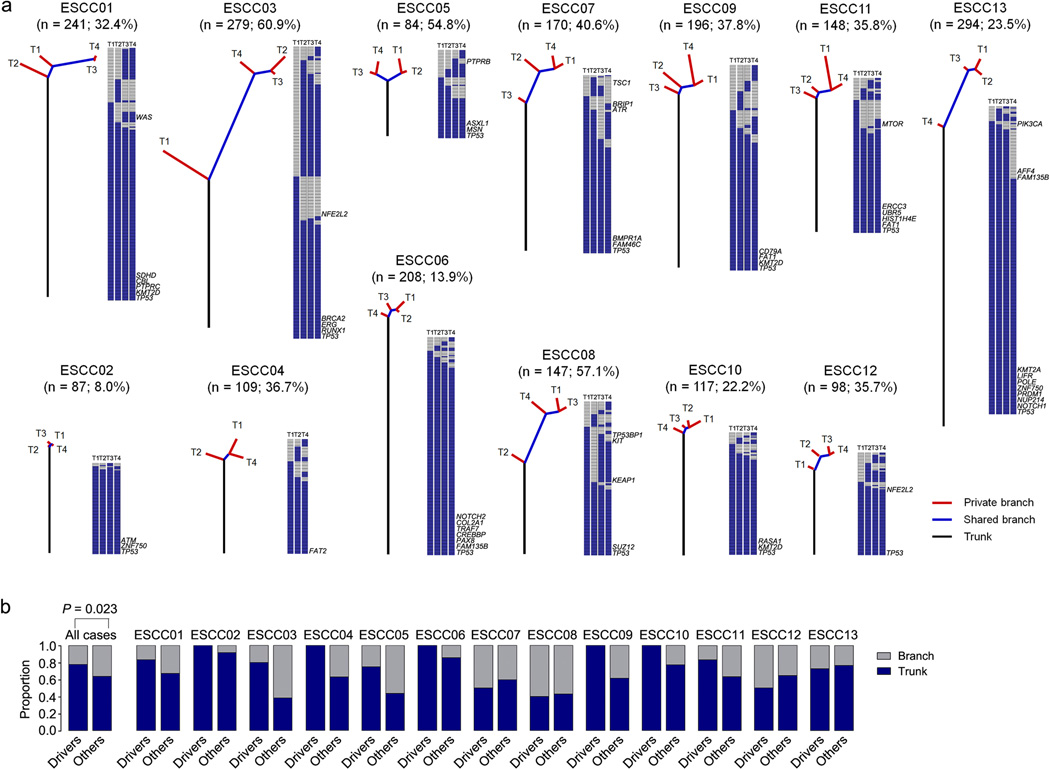
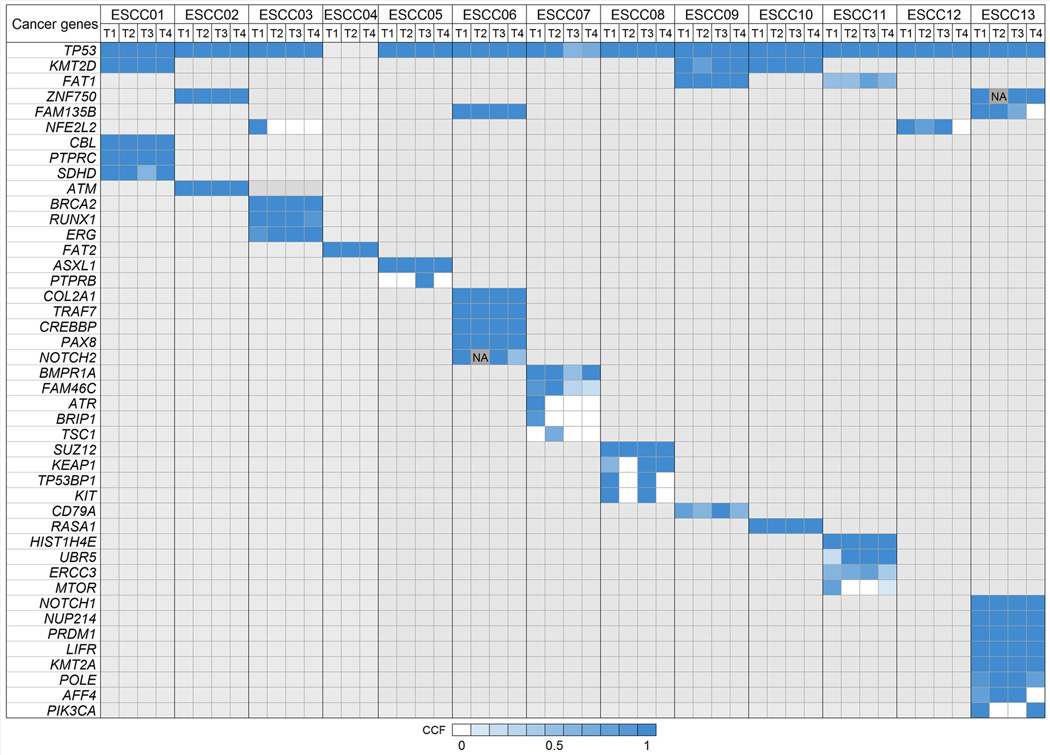
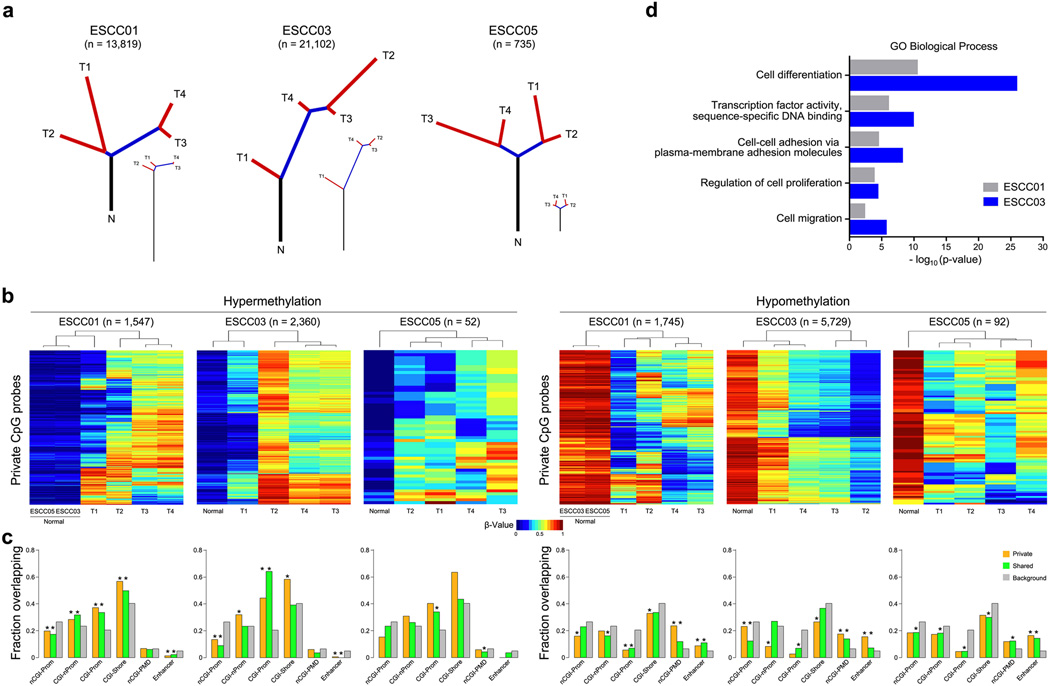
Esophageal squamous cell carcinoma (ESCC) is among the most common malignancies, but little is known about its spatial intratumoral heterogeneity (ITH) and temporal clonal evolutionary processes. To address this, we performed multiregion whole-exome sequencing on 51 tumor regions from 13 ESCC cases and multiregion global methylation profiling for 3 of these 13 cases. We found an average of 35.8% heterogeneous somatic mutations with strong evidence of ITH. Half of the driver mutations located on the branches of tumor phylogenetic trees targeted oncogenes, including PIK3CA, NFE2L2 and MTOR, among others. By contrast, the majority of truncal and clonal driver mutations occurred in tumor-suppressor genes, including TP53, KMT2D and ZNF750, among others. Interestingly, phyloepigenetic trees robustly recapitulated the topological structures of the phylogenetic trees, indicating a possible relationship between genetic and epigenetic alterations. Our integrated investigations of spatial ITH and clonal evolution provide an important molecular foundation for enhanced understanding of tumorigenesis and progression in ESCC.


Figures

Fig. 1
Fig. 1. ITH of somatic mutations in 13 ESCCs generated by M-WES
(a) Phylogenetic trees were constructed from all somatic mutations by the Wagner parsimony method using PHYLIP (See Method). Lengths of trunks and branches are proportional to the numbers of mutations acquired. Heat maps showed the presence (blue) or absence (gray) of a somatic mutation in each tumor region (T). Each gene was arranged in a row, and cancer genes with putative driver mutations were indicated. The total number of mutations (n), and the proportions of branched mutations in each case, were provided above each tree. (b) Bar plots showed the proportions of putative driver mutations versus other mutations on the trunks and branches. Statistical differences of truncal and branched proportions, between driver and other mutations across all cases, were analyzed using a χ2 test, and a significant P value was shown.
Fig. 2
Fig. 2. Clonal status of putative driver mutations in ESCC tumors
A heatmap displayed the cancer cell fraction (CCF) of driver mutations in each region of the ESCC tumors. Genomic regions with no segmentation data available were shown as NA.
Fig. 3
Fig. 3. Temporal dissection of mutational signatures in ESCC tumors
(a) The 96 trinucleotide mutational spectrum of truncal (Bottom panel) and branched (Top panel) mutations across all regions was inferred by deconstructSigs. (b) Dot plots displayed the contributions of individual mutational signatures to individual cases, with each dot representing one case. Signatures 1–30 were based on the Wellcome Trust Sanger Institute COSMIC Mutational Signature Framework. Inferred signatures included: Signature 1 (associated with age), Signatures 2 and 13 (associated with APOBEC), Signatures 6 and 15 (associated with DNA mismatch repair), Signature 3 (associated with DNA double-strand break-repair), Signature 7 (associated with UV exposure in squamous cancer). The bars represent the mean values. (c, d) Piecharts displayed the truncal and branch mutational signatures in cases ESCC10 and ESCC12, and only signatures with contributions over 10% were indicated.
Fig. 4
Fig. 4. Epigenetic ITH in ESCC
(a) Phyloepigenetic trees of three ESCC cases. Lengths of trunks and branches were inferred using a phylogenetic approach, based on Euclidean distances between different tumor regions using private probes (see Methods). The total number of probes (n) was provided above each tree. For comparison, phylogenetic trees from Fig. 1 were reproduced below each phyloepigenetic tree. (b) Heatmaps showed the beta values of private probes for each case, separated into hyper- and hypo-methylation. (c) Overlap between each probe set from panel (b), and a variety of functional genomic contexts: non-CpG Island Promoters (nCGI-Prom), non-Promoter CpG Islands (CGI-nProm), CpG Island Promoters (CGI-Prom), CpG Island Shores (CGI-Shore), Partially Methylated Domains excluding CpG Islands (nCGI-PMD) and enhancers. Overlapping frequencies of private probes from panel (b) were shown in yellow, shared probes (Supplementary Fig. 9) in green, and gray showed the frequency for the entire set of probes on the array. The hypergeometric test (* = P < 10−5) was used to compare the frequency of each private and shared probe set category to that of array background (see Methods). (d) Enriched GO biological processes for the genes associated with privately hypermethylated promoters in ESCC01 and ESCC03 (case ESCC05 was excluded due to the lack of sufficient privately hypermethylated promoters).

Comment in

References

    1. Torre LA, et al. Global cancer statistics, 2012. CA Cancer J Clin. 2015;65:87–108. - PubMed
    1. Ferlay J, et al. Cancer incidence and mortality worldwide: sources, methods and major patterns in GLOBOCAN 2012. Int J Cancer. 2015;136:E359–E386. - PubMed
    1. Enzinger PC, Mayer RJ. Esophageal cancer. N Engl J Med. 2003;349:2241–2252. - PubMed
    1. Agrawal N, et al. Comparative genomic analysis of esophageal adenocarcinoma and squamous cell carcinoma. Cancer Discov. 2012;2:899–905. - PMC - PubMed
    1. Song Y, et al. Identification of genomic alterations in oesophageal squamous cell cancer. Nature. 2014;509:91–95. - PubMed

METHODS-ONLY REFERENCES

    1. Chen W, et al. Cancer statistics in China, 2015. CA Cancer J Clin. 2016;66:115–132. - PubMed
    1. Faust GG, Hall IM. SAMBLASTER: fast duplicate marking and structural variant read extraction. Bioinformatics. 2014;30:2503–2505. - PMC - PubMed
    1. Van der Auwera GA, et al. From FastQ data to high confidence variant calls: the Genome Analysis Toolkit best practices pipeline. Curr Protoc Bioinformatics. 2013;43:11.10.1–11.10.33. - PMC - PubMed
    1. Koboldt DC, et al. VarScan 2: somatic mutation and copy number alteration discovery in cancer by exome sequencing. Genome Res. 2012;22:568–576. - PMC - PubMed
    1. Li H, et al. The Sequence Alignment/Map format and SAMtools. Bioinformatics. 2009;25:2078–2079. - PMC - PubMed

Publication types

Substances