. 2016 Oct 17;11(10):e0164660.
doi: 10.1371/journal.pone.0164660. eCollection 2016.

PlexinD1 Is a Novel Transcriptional Target and Effector of Notch Signaling in Cancer Cells

Affiliations

PlexinD1 Is a Novel Transcriptional Target and Effector of Notch Signaling in Cancer Cells

Michael Rehman et al. PLoS One. .

Erratum in

Abstract

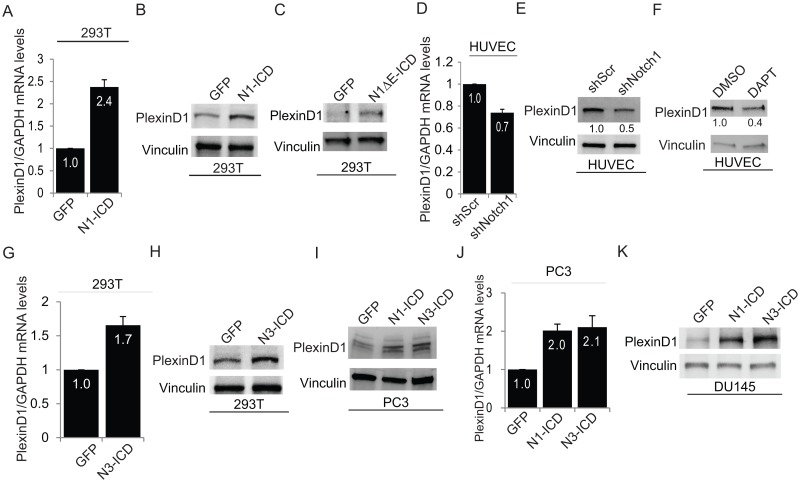
The secreted semaphorin Sema3E controls cell migration and invasiveness in cancer cells. Sema3E-receptor, PlexinD1, is frequently upregulated in melanoma, breast, colon, ovarian and prostate cancers; however, the mechanisms underlying PlexinD1 upregulation and the downstream events elicited in tumor cells are still unclear. Here we show that the canonical RBPjk-dependent Notch signaling cascade controls PlexinD1 expression in primary endothelial and cancer cells. Transcriptional activation was studied by quantitative PCR and promoter activity reporter assays. We found that Notch ligands and constitutively activated intracellular forms of Notch receptors upregulated PlexinD1 expression; conversely RNAi-based knock-down, or pharmacological inhibition of Notch signaling by gamma-secretase inhibitors, downregulated PlexinD1 levels. Notably, both Notch1 and Notch3 expression positively correlates with PlexinD1 levels in prostate cancer, as well as in other tumor types. In prostate cancer cells, Sema3E-PlexinD1 axis was previously reported to regulate migration; however, implicated mechanisms were not elucidated. Here we show that in these cells PlexinD1 activity induces the expression of the transcription factor Slug, downregulates E-cadherin levels and enhances cell migration. Moreover, our mechanistic data identify PlexinD1 as a pivotal mediator of this signaling axis downstream of Notch in prostate cancer cells. In fact, on one hand, PlexinD1 is required to mediate cell migration and E-cadherin regulation elicited by Notch. On the other hand, PlexinD1 upregulation is sufficient to induce prostate cancer cell migration and metastatic potential in mice, leading to functional rescue in the absence of Notch. In sum, our work identifies PlexinD1 as a novel transcriptional target induced by Notch signaling, and reveals its role promoting prostate cancer cell migration and downregulating E-cadherin levels in Slug-dependent manner. Collectively, these findings suggest that Notch-PlexinD1 signaling axis may be targeted to impair prostate cancer cell invasiveness and metastasis.


Conflict of interest statement

The authors have declared that no competing interests exist.

Figures

Fig 1
Fig 1. PlexinD1 is a putative Notch signaling target.
(A, B) HEK-293T cells were transiently transfected with a constitutively activated Notch-intracellular domain construct (N1-ICD) or with GFP expressing construct. PlexinD1 mRNA levels were measured by qPCR after 72 hrs (A), and protein lysates were analyzed by immunoblotting for PlexinD1 and vinculin (B). (C) HEK-293T cells were transiently transfected with Notch1 ΔE-ICD and cell lysates were immunoblotted for PlexinD1 and vinculin, as above. (D, E) HUVEC endothelial cells were transduced to stably express Notch1-targeted shRNAs (shNotch1); mRNA levels were analyzed by qPCR (D), and protein lysates by immunoblotting (E; relative PlexinD1 band intensity to vinculin levels was quantified and normalized to controls), as above. (F) HUVEC cells were treated with gamma-secretase inhibitor DAPT (25μM) to block Notch signaling, or DMSO (vehicle), for 72 hrs; lysates were analyzed by immunoblotting for PlexinD1 and vinculin (relative PlexinD1 band intensity to vinculin levels was quantified and normalized to controls). (G, H) HEK-293T cells were transiently transfected with activated Notch3 intracellular domain (N3-ICD); after 72hrs, mRNA levels (G) and protein lysates (H) were analyzed, as above. (I, J) PC3 prostate cancer cells transiently transfected with N1-ICD or N3-ICD were analyzed for expression of PlexinD1 by qPCR (I) or western blotting (J). (K) DU145 prostate cancer cells transiently transfected with N1-ICD and N3-ICD were analyzed by immunoblotting for PlexinD1 and vinculin, as above. Mean values ± SD are shown in all graphs; relative gene expression levels were normalized to controls.
Fig 2
Fig 2. Notch signaling upregulates PlexinD1 promoter activity.
(A) Schematic of the reporter construct pEZX-PGO2, containing a 1567 bp region from PLXND1 gene promoter (position 1 being transcription start) fused to Gaussia luciferase reporter cassette, and of two mutant constructs with deletions of RBPjk binding site (positioned at -1382 bp upstream transcription start). (B) PLXND1 promoter-induced Gaussia luciferase activity was revealed in cell-conditioned media of 293T cells co-transfected with mock plasmid, or with N1-ICD (indicated amounts), in combination with the reporter construct. (C) 293T cells were transiently co-transfected with either mock plasmid, N1-ICD or N3-ICD in combination with PlexinD1 promoter reporter construct. (D) Luciferase reporter activity was tested in 293T cells transiently transfected with N1-ICD (or mock), in association with PLXND1 promoter region (Long D1) or with mutated promoter constructs lacking RBPjk binding sites (Mut1_D1 and Mut2_D1, described in panel (A). (E) 293T cells were transiently transfected with the indicated amounts of RBPjk cDNA; cell lysates were analyzed by immunoblotting for PlexinD1 and vinculin; relative band intensity was quantified and normalized to control. (F) 293T cells were transiently co-transfected with wild-type RBPjk or dominant-negative RBPjk (or mock) in combination with PLXND1 promoter reporter construct, and luciferase activity was revealed in cell-conditioned media, as in (B). Bar graphs indicate mean values (normalized to controls) ± normalized SD.
Fig 3
Fig 3. Downregulation of Notch signaling inhibits PlexinD1 expression.
(A) PC3 stably expressing shNotch1 or scrambled shRNA (shScr) as control were generated, and protein lysates were analyzed by immunoblotting to reveal PlexinD1, Notch1 (intracellular domain, at 110 kDa) and vinculin levels. (B) As above, PlexinD1, Notch1-ICD and vinculin levels were analyzed by immunoblotting in DU145 stably expressing shScr or shNotch1, as in (A). (C, D) PC3 and DU145 cells transfected with PLXND1 promoter reporter construct (as in Fig 2) were treated with Notch inhibitors DAPT (25μM) and RO4929097 (25μM) for 72 hrs, and Gaussia luciferase activity was assessed to reveal PLXND1 promoter regulation.
Fig 4
Fig 4. Notch and PlexinD1 signaling regulate prostate cancer cell migration.
(A) Wound healing assay in PC3 cells treated with gamma secretase inhibitors—DAPT and RO4929097 (as in Fig 3C). Wound closure (24 hours from scratch) was quantified relative to wound width at start time. (B, C) The migration of PC3 cells stably expressing shScr, shNotch1, shPlexinD1 was analyzed in wound healing assays, as above. Panel B shows the quantification of wound sizes at the end of the experiment. (D) The migration of PC3 cells stably expressing shScr, shPlexinD1 and shNotch1 was assayed in overnight Boyden chamber experiments with transwell inserts. Bar graphs indicate mean values ± SD (normalized to controls). (E) PC3 cells overexpressing Dll1-Fc and Jag1-Fc were analyzed in Boyden chamber experiment, as above. (F) PC3 cells transduced to express an autocrine p61-Sema3E circuit were analyzed in Boyden chamber experiments, as above. (G) PC3 cells stably expressing shSema3E compared to shScr were analyzed in Boyden chamber experiments, as above. Mean ± SD is shown in all graphs; values were normalized to respective controls.
Fig 5
Fig 5. Notch1, Notch3 and PlexinD1 regulate EMT markers in prostate cancer cells.
(A) PC3 were transiently transfected with GFP, N1-ICD, N3-ICD or PlexinD1, and the mRNA levels of Snail, Slug, Zeb1, Zeb2, Twist1 were analyzed by qPCR (48 hours later). (B) PC3 cells were transfected with GFP, Jag1-Fc, or Sema3E-p61; Slug mRNA levels were analyzed, as above. (C) Slug mRNA levels were assessed in PC3 cells stably expressing pLKO or silenced for Notch1 and PlexinD1. (D) PC3 transiently transfected with pLKO, N1-ICD and PlexinD1 were analyzed for E-cadherin mRNA levels by qPCR. (E) PC3 cells were transiently transfected with GFP, N1-ICD or N3-ICD; after 48 hrs lysates were analyzed by immunoblotting to reveal E-cadherin levels. (F, G) PC3 and DU145 cells transfected with PlexinD1 were analyzed by immunoblotting to reveal E-cadherin levels. (H, I) PC3 and DU145 cells, respectively, stably expressing shScr, shPlexinD1 and shNotch1 were analyzed by immunoblotting to reveal E-cadherin levels. (J) PC3 cells were treated with DMSO, DAPT (25μM) or RO4929097 (25μM) for 72 hrs and protein lysates were analyzed to reveal E-cadherin levels. (K, L) PC3 cells stably expressing shScr or shSema3E were analyzed by western blotting (K) or qPCR (L) to reveal E-cadherin levels. (M) Analysis of E cadherin levels by immunoblotting in PC3 cells stably silenced for Sema3E, and upon re-expression of Sema3E-p61 (S3E-p61). (N) E cadherin and Slug expression levels assessed by qPCR upon overexpression of Sema3E-p61 in control and Slug-depleted cells (by siRNA). (O) The migration of PC3 cells treated as in previous panels was assessed in Boyden Chamber assays. (P) Immunoblotting analysis of E cadherin levels in PC3 cells transfected to overexpress PlexinD1 (or mock), with or without treatment with MAPK inhibitor PD98059 (10μM). Bar graphs display mean values ± SD.
Fig 6
Fig 6. PlexinD1 acts downstream of Notch signaling in down-regulating E-cadherin and promoting cancer cell migration.
(A, B) PC3 cells were transiently transfected with either shScr, N1-ICD, shPlexinD1, or a combination of N1-ICD and shPlexinD1. 72 hrs after transfection, cell migration was analysed by Boyden chamber assays (A). Moreover, cell lysates were analyzed by immunoblotting to reveal E-cadherin, Notch1-ICD and vinculin levels (B); relative E-cadherin band intensity to vinculin levels was quantified and normalized to controls. (C, D) PC3 cells were transiently transfected with either shScr, shNotch1, PlexinD1, or a combination of shNotch1 and PlexinD1. 72 hrs after transfection, cell migration was analysed by Boyden chamber assays (C). Moreover, cell lysates were analyzed by immunoblotting to reveal E-cadherin, N1-ICD, PlexinD1 and vinculin levels (D) and relative E-cadherin band intensity to vinculin levels was quantified and normalized to controls. (E, F) PC3 cells transfected as in C-D were analyzed in vivo by metastatic extravasation assay upon tail vein injection in mice. Representative images are shown (E) along with fluorescence intensity quantification (F). Bar graphs show mean values ± SD (normalized to control).

References

    1. Tamagnone L, Artigiani S, Chen H, He Z, Ming GI, et al. (1999) Plexins are a large family of receptors for transmembrane, secreted, and GPI-anchored semaphorins in vertebrates. Cell 99: 71–80. - PubMed
    1. Tamagnone L (2012) Emerging role of semaphorins as major regulatory signals and potential therapeutic targets in cancer. Cancer Cell 22: 145–152. 10.1016/j.ccr.2012.06.031 - DOI - PubMed
    1. Rehman M, Tamagnone L (2013) Semaphorins in cancer: biological mechanisms and therapeutic approaches. Semin Cell Dev Biol 24: 179–189. 10.1016/j.semcdb.2012.10.005 - DOI - PubMed
    1. Sakurai A, Gavard J, Annas-Linhares Y, Basile JR, Amornphimoltham P, et al. (2010) Semaphorin 3E initiates antiangiogenic signaling through plexin D1 by regulating Arf6 and R-Ras. Mol Cell Biol 30: 3086–3098. 10.1128/MCB.01652-09 - DOI - PMC - PubMed
    1. Casazza A, Finisguerra V, Capparuccia L, Camperi A, Swiercz JM, et al. (2010) Sema3E-Plexin D1 signaling drives human cancer cell invasiveness and metastatic spreading in mice. J Clin Invest 120: 2684–2698. 10.1172/JCI42118 - DOI - PMC - PubMed

MeSH terms