. 2016 Oct 27;538(7626):518-522.
doi: 10.1038/nature19801. Epub 2016 Oct 17.

T-cell acute leukaemia exhibits dynamic interactions with bone marrow microenvironments

Affiliations

T-cell acute leukaemia exhibits dynamic interactions with bone marrow microenvironments

Edwin D Hawkins et al. Nature. .

Abstract

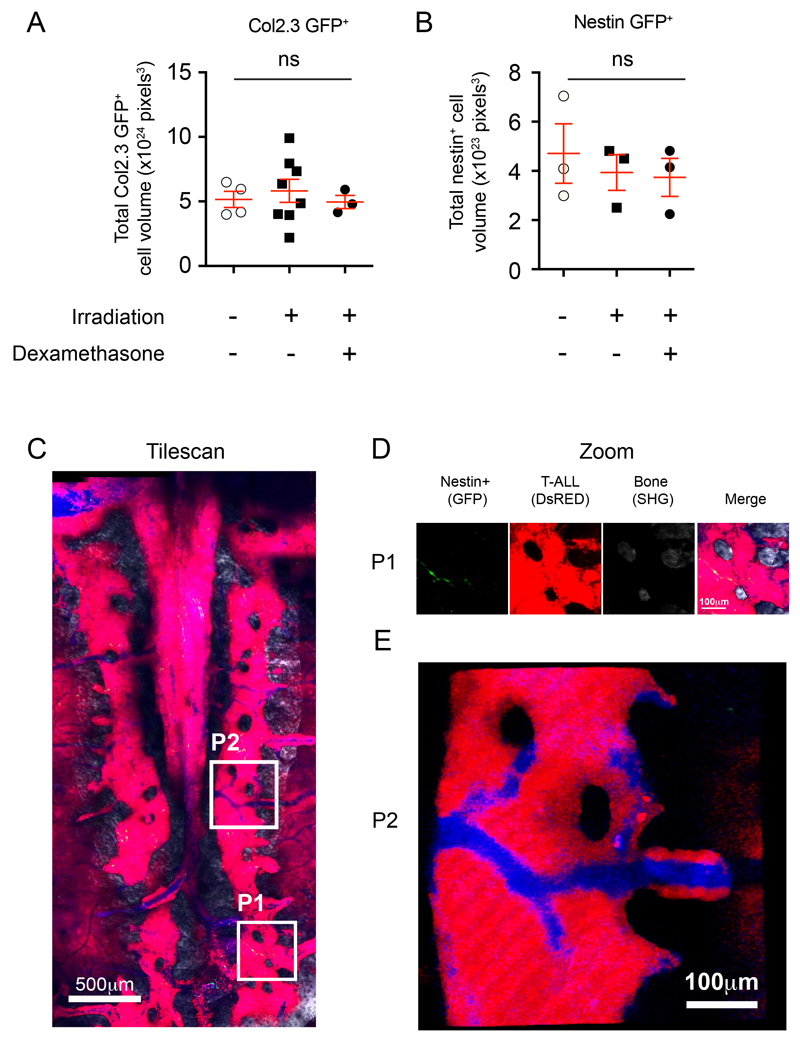
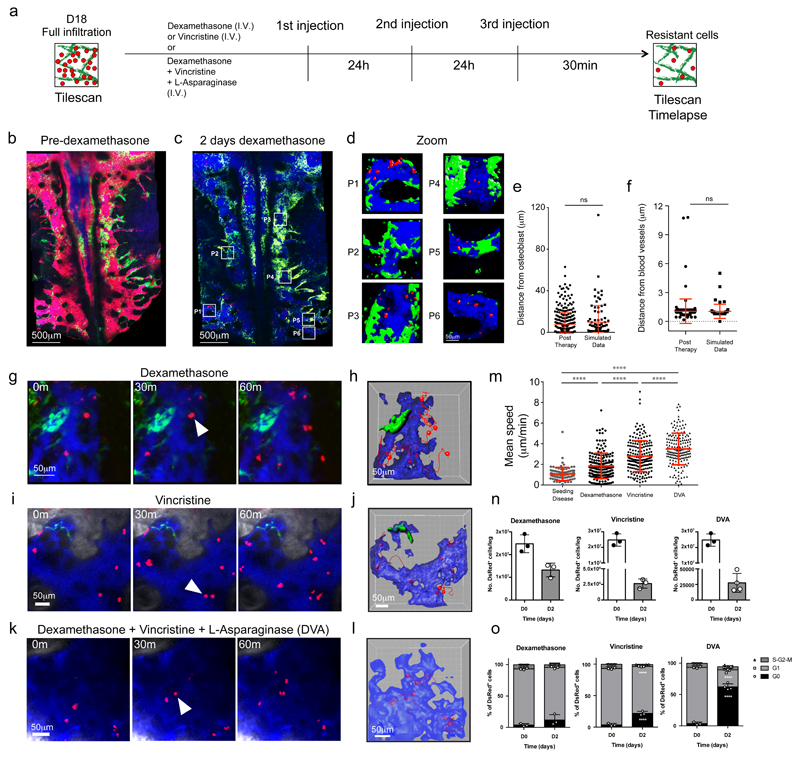
It is widely accepted that complex interactions between cancer cells and their surrounding microenvironment contribute to disease development, chemo-resistance and disease relapse. In light of this observed interdependency, novel therapeutic interventions that target specific cancer stroma cell lineages and their interactions are being sought. Here we studied a mouse model of human T-cell acute lymphoblastic leukaemia (T-ALL) and used intravital microscopy to monitor the progression of disease within the bone marrow at both the tissue-wide and single-cell level over time, from bone marrow seeding to development/selection of chemo-resistance. We observed highly dynamic cellular interactions and promiscuous distribution of leukaemia cells that migrated across the bone marrow, without showing any preferential association with bone marrow sub-compartments. Unexpectedly, this behaviour was maintained throughout disease development, from the earliest bone marrow seeding to response and resistance to chemotherapy. Our results reveal that T-ALL cells do not depend on specific bone marrow microenvironments for propagation of disease, nor for the selection of chemo-resistant clones, suggesting that a stochastic mechanism underlies these processes. Yet, although T-ALL infiltration and progression are independent of the stroma, accumulated disease burden leads to rapid, selective remodelling of the endosteal space, resulting in a complete loss of mature osteoblastic cells while perivascular cells are maintained. This outcome leads to a shift in the balance of endogenous bone marrow stroma, towards a composition associated with less efficient haematopoietic stem cell function. This novel, dynamic analysis of T-ALL interactions with the bone marrow microenvironment in vivo, supported by evidence from human T-ALL samples, highlights that future therapeutic interventions should target the migration and promiscuous interactions of cancer cells with the surrounding microenvironment, rather than specific bone marrow stroma, to combat the invasion by and survival of chemo-resistant T-ALL cells.


Conflict of interest statement

The authors have no competing financial interests regarding to the work in this manuscript.

Figures

Extended Data Figure 1
Extended Data Figure 1. T-ALL disease experimental model.
Foetal liver single cell suspensions were isolated from E14.5 wild type embryos and transduced with DsRed alone or DsRed with NotchICNΔRamΔP then transplanted into primary lethally irradiated recipient mice. Recipient mice typically accumulated CD4+CD8+ cells in the peripheral blood from 4 weeks post transplant. Transformed leukaemic cells could be distinguished from non-malignant cells based on DsRed expression levels, where DsREDlo cells were transduced with the Notch construct yet were non malignant as they had not yet acquired secondary mutations to drive leukaemogenesis, whereas DsRedhi cells were fully malignant. DsRedlo cells contained single positive CD4+ and CD8+ T cell populations, whereas DsRedhi cells had predominantly the leukaemic CD4+CD8+ phenotype. The accumulation of transformed leukaemic populations displayed large variation over time as shown in the ratio of transformed to non-malignant cells in peripheral blood of primary recipient mice at 6 and 9 weeks. When DsRedhi cells dominated peripheral cell populations, mice were burdened with typical CD4+CD8+ T-ALL (now simply referred to as DsRed+). When primary recipient mice displayed enlarged lymph nodes and/or spleen, they were euthanized and DsRed+ cells were harvested, stored frozen and transplanted into secondary recipients. CXCR4 expression was measured in CD4+ T cells, CD8+ T cells and T-ALL by flow cytometry (T-ALL from four primary donors) and microarray gene expression analysis (triplicate biological replicates are shown for control T cells, and samples from nine individual secondary recipients injected with 5 independent primary T-ALL samples). To track disease progression, 10,000 primary T-ALL cells were transplanted into cohorts of sub-lethally irradiated secondary recipient mice. Secondary transplanted cells colonized the bone marrow primarily, before spreading to peripheral organs and blood (n = 4 mice per time point) and developed disease more rapidly and synchronously than primary recipients as injected cells were already transformed. Secondary recipients survived for up to 38 days (shown are survival data of mice injected with 4 independent primary T-ALL samples [●, ❑, * and Δ], n = 2 mice per primary sample). In selected cases, secondary T-ALL blasts were transplanted into tertiary recipients, which developed disease more rapidly but showed similar responses to chemotherapy. The primary samples used in this study were from primary recipients 151, 907, B2M2, B2M3, B2M10, B3M3 and B3M30. This nomenclature refers to the mouse numbering from three independent foetal liver transductions. 1st transduction: mouse 151 and 907, 2nd transduction (B2): mouse 2, 3 and 10; 3rd transduction (B3): mouse 3 and mouse 30.
Extended Data Figure 2
Extended Data Figure 2. Four-dimensional multi-position imaging of leukaemia cells in the BM space.
(A) Representative maximum projection tilescan of a Col2.3-GFP recipient mouse (from figure 2) 12 days post-transplant of DsRed+ T-ALL. Red: T-ALL cells; green: GFP+ osteoblastic cells; blue: blood vessels; grey: bone collagen. (B) Individual positions (framed in A) were selected and imaged at three-minute intervals for three hours to measure cell migration and division. Shown here are a single time frame/position. For full time-lapse data see Supplementary Video 2 (C) 3D rendering of the three dimensional tracks of individual leukaemia cells, measured using semi-automated tracking (red), overlaid to vasculature (blue). Spheres represent the beginning of each track. (D) Data from C is shown with osteoblasts included in green. (E) Tracks from C colour-coded based on time. Long stretches of the same colour correspond to faster movement, while rapid colour shifts represent slower movement. Data are representative of >30 time-lapse videos collected from eight secondary recipients injected with three independent primary T-ALL samples.
Extended Data Figure 3
Extended Data Figure 3. T-ALL expansion is not associated with Col2.3-GFP+ osteoblastic cells and Nestin-GFP+ cells.
(A) Representative tilescan of a Col2.3-GFP mouse 15 days post transplantation of T-ALL. Zooms P1-P4 illustrate that the expansion of disease is not associated with the presence or absence of GFP+ osteoblaststic cells. Red: T-ALL, Green: osteoblastic cells, Blue: blood vessels. Image is representative of 5 mice injected with 2 individual T-ALL primary samples. (B) Representative tilescan of a Nestin-GFP mouse 15 days post transplantation of T-ALL. Zooms P1-P3 illustrate that the expansion of disease is not associated with the presence or absence of nestin-GFP+ cells. Red: T-ALL, Green: nestin+ cells, Blue: blood vessels, Grey: bone collagen SHG signal. Image is representative of 3 individual mice.
Extended Data Figure 4
Extended Data Figure 4. T-ALL expansion is not associated with bone marrow areas containing nestin-GFP+, Col2.3-GFP+ cells or any combination of them.
Representative tilescan of a Col2.3-CFP/Nestin-GFP double transgenic mouse 15 days post transplantation of T-ALL. Zooms P1-P3 illustrate that the expansion of disease is not associated with the presence or absence of any combination of Col2.3-CFP+ or Nestin-GFP+ cells. Yellow: T-ALL, Green: Nestin-GFP+ cells, Blue: Col2.3-CFP+ cells, Magenta: Cy5 labelled blood vessels, Grey: bone collagen SHG signal. Image is representative of 4 mice.
Extended Data Figure 5
Extended Data Figure 5. Dexamethasone-resistant T-ALL cells do not associate with Nestin-GFP+ cells.
(A) Representative nestin-GFP mouse transplanted with T-ALL cells and imaged 18 days post-transplant to confirm complete BM infiltration (left). Tilescan imaging was repeated after two days of treatment with 15mg/kg dexamethasone I.V. (right). (B) Magnified view of representative positions, framed in A. (C) We observed no preferential positioning of T-ALL surviving cells relative to Nestin+ cells compared to simulated data. Red: T-ALL, Green: Nestin-GFP+ cells, Blue: blood vessels. Data is representative of 4 individual mice injected with 2 T-ALL primary samples. (D) Chimeric mice were generated by transplanting mTmG - tomato+ BM into Col2.3-GFP recipients. The high reconstitution efficiency of mTmG cells provided a more robust traceable marker of steady state haematopoiesis for intravital imaging than MigR1-DsRed transduced foetal liver cells (<40% reconstitution, not shown). (E) Representative tilescans of mTmG/Col2.3-GFP chimeric mouse performed before, and after three doses of dexamethasone treatment showing that healthy bone marrow is not affected by dexamethasone treatment or sub-lethal irradiation. Red: tomato positive, healthy mTmG BM; green: GFP+ osteoblastic cells; blue: blood vessels. n = 2 mice.
Extended Data Figure 6
Extended Data Figure 6. Multi-day time course of response to chemotherapy.
(A) Representative maximum projections of tilescans of calvarium bone marrow of one Col2.3-CFP and one Nestin-GFP mouse at 18 days post T-ALL transplant (pre-treatment) and 1 and 2 days of dexamethasone treatment (15mg/kg). Red squares indicate some areas of cell loss from day 1 to day 2. (B) 3D measurement of the position of surviving cells in mice imaged at both 1 and 2 days of dexamethasone treatment. n = 1499 and 352 T-ALL cells measured to osteoblastic-CFP+ cells at day 1 and day 2, respectively, and 363 and 496 T-ALL cells measured to nestin-GFP+ cells at day 1 and day 2, respectively. Data are representative from 3 individual mice of each genotype. Error bars in B: mean ± S.D.
Extended Data Figure 7
Extended Data Figure 7. Development of resistance to dexamethasone and gene expression-based clustering of leukaemia samples harvested before and after dexamethasone treatment.
(A) Representative maximum projection of tilescan of calvarium bone marrow of a mouse after 7 days of daily dexamethasone treatment (15 mg/kg, I.V.). Red = DsRed+ T-ALL cells. Data are representative of 4 independent mice injected with 4 independent T-ALL primary samples. (B) Mice with T-ALL were either kept untreated or treated with dexamethasone for 7 days, at which point they were culled and the expression of CXCR4 on T-ALL cells analysed by flow cytometry. There was no statistically significant difference in the mean fluorescence intensity (MFI) of CXCR4 between the two groups. Data are representative of 6 untreated and 5 treated mice, injected with 3 independent T-ALL primary samples. (C) Multi-dimensional scaling (MDS) plot of control CD4+ T cells, CD8+ T cells, CD4+8+ thymocytes, whole bone marrow and T-ALL samples with no treatment (grey) or after treatment with dexamethasone (red) based on microarray transcriptomics data for the 1000 most variable genes. The name of the primary T-ALL sample used to inject each mouse is indicated next to the dot marking its position relative to all other samples. This nomenclature refers to the mouse numbering from three independent foetal liver transductions. 1st transduction: mouse 907; 2nd transduction (B2): mouse 2 – B2M2, mouse 3 – B2M3 - and 10 – B2M10; 3rd transduction (B3): mouse 3 – B3M3 - and mouse 30 – B3M30. Control samples are purified by flow cytometry from 3 biological replicate mice and each circle represents an individual sample.
Extended Data Figure 8
Extended Data Figure 8. Analysis of human T-ALL cells during response to chemotherapy in NSG xenotransplant recipients.
Human T-ALL samples were transplanted into NOD/SCID/γ (NSG) mice and 12 days post transplant, daily dexamethasone treatment at 15mg/kg was initiated. 14 days later, the response was measured by flow cytometry (A, B). For intravital imaging, human T-ALL cells were labelled by injection of 10μg anti-human CD45-PE 15-30 minutes before imaging (C). Cells were imaged at 3 minute intervals for > 60 minutes and migration measured by manual tracking either before or after dexamethasone treatment (D). Pre dex: n = 82 cells from 2 independent mice, 14 days dex: n = 100 from 3 independent mice. Error bars = mean +/- S.D. Shown are cells from patient JH, wild type Notch. (E) Bone marrow sections were prepared from untreated and treated NSG mice and stained for human CD45 (red) and Ki-67 (green). In addition, nuclei were visualized using DAPI (blue) and bone by second harmonic generation signal (grey). Zooms are of the areas framed by the white boxes on their left. (F) Analysis of 2338 (untreated) and 1576 (14 days dex) human CD45+ cells in sections from 3 mice per condition reveals no change in the fraction of proliferating Ki-67+ cells following dexamethasone treatment.
Extended Data Figure 9
Extended Data Figure 9. Combined dexamethasone, vincristine and L-asparaginase treatment effectively reduces T-ALL burden.
(A) Representative tilescan of a mouse calvarium fully infiltrated with T-ALL (pre DVA) and after 2 days of combination therapy (dexamethasone, vincristine and L-asparaginase – DVA). (B) Zooms P1 and P2 illustrate effectiveness of DVA treatment and the small number of surviving T-ALL cells. Red: T-ALL, Blue: blood vessels, Grey: SHG bone collagen. Image is representative of four mice injected with one individual T-ALL secondary sample.
Extended Data Figure 10
Extended Data Figure 10. Analysis of the response of bone marrow structures to irradiation and dexamethasone treatment and of Nestin-GFP+ cells to T-ALL.
(A) Col2.3-GFP or (B) Nestin-GFP mice were treated with combinations of sublethal irradiation (administered >18 days before measurement) or dexamethasone treatment (administered for 2 days before measurement) as indicated. Then, using 3D image analysis of tilescans, the total volume of GFP+ cells was quantified. Groups were analysed using ANOVA with Bonferroni correction for multiple groups. Error bars = Mean +/- S.D. (C) Representative tilescan of nestin-GFP mouse transplanted with T-ALL 21 days earlier. At infiltration levels that eradicated osteoblasts, we still observed healthy nestin-GFP+ cells. (D) Higher magnification of area P1 framed in A, with the signal from each channel split for clarity. (E) Three dimensional render at higher magnification of area P2 framed in A, showing healthy blood flow within the highly infiltrated BM space. Red: T-ALL, Green: Nestin-GFP+ cells, Blue: blood vessels. Grey: bone collagen SHG signal. n = 5 independent mice injected with 2 independent T-ALL primary samples.
Figure 1
Figure 1. Experimental set up and T-ALL BM seeding
(a) Image data sets were formed of multiple, overlapping z-stacks covering the entire calvarium BM space. (b) Tilescans preserve single cell resolution. (c) Long-term single cell time-lapse (14 hours). Arrows: division and daughter cells. (d) Intravital imaging schedule. (e and f) Representative maximum projection tilescans showing T-ALL distribution in Col2.3-GFP (e) and nestin-GFP (f) recipient mice calvarium bone marrow, and corresponding high-magnification 3D renders. (g) Simulated cells (white) were randomly distributed within BM space, for control positional measurements. (h-j) T-ALL cell location relative to osteoblasts (h), nestin cells (i) and blood vessels (j) compared to randomly positioned dots overlaid on tilescans. Red: T-ALL cells; green: osteoblasts/nestin cells; blue: vasculature. n= 190, 117, 135 cells and 91, 168, 70 random dots, respectively in h, i, j; data representative of/pooled from seven (e, f, h, i) and four independent mice (biological replicates) injected with cells from two independent primary donors. Error bars: mean±S.D.
Figure 2
Figure 2. Four-dimensional imaging of leukaemia interactions in BM.
(a) Maximum projection tilescan of a Col2.3-GFP recipient mouse 12 days post-transplant of T-ALL cells. (b) Individual positions (framed in a) were imaged at three-minute intervals for three hours. Red: T-ALL cells; green: osteoblasts; blue: vasculature; grey: bone; arrows: mitosis. (c) 3D cell tracks (temporally colour-coded) of individual leukaemia cells. Grey: vasculature; green: osteoblasts; red spheres: T-ALL cells at beginning of imaging period; *: finishing position of daughter cells; arrows: mitosis. (d, e) Position of mitosis relative to (d) GFP+ osteoblasts (n = 46) or (e) nestin cells (n = 30) compared to randomly generated dots (n = 48 and 28 respectively). Data in a-d are representative of/pooled from eight mice (biological replicates) injected with T-ALL isolated from three primary donors. Data in e are pooled from four individual mice (biological replicates) injected with T-ALL from two primary donors. Error bars: mean±SEM.
Figure 3
Figure 3. Multi-day imaging of chemotherapy.
(a) Intravital microscopy and treatment schedule. (b) Representative maximum projection of Col2.3-GFP calvarium bone marrow 18 days post T-ALL transplant and (c) of the same mouse after 2 days of dexamethasone treatment (high-magnification 3D renders of boxed areas shown in d). (e, f) Measurement of surviving cells position relative to the closest (e) osteoblastic cell (n: 303 real and 91 artificial cells) or (f) blood vessel (n: 143 real and 55 artificial cells). b-f: data representative of/pooled from five mice with T-ALL cells from two primary donors. (g-l) Positions imaged at three-minute intervals for three hours in mice treated with dexamethasone (g), vincristine (i) and dexamethasone, vincristine and L-asparaginase (DVA) (k). Arrows: mitosis; green: osteoblastic (g) or nestin cells (i); blue: vasculature; red: T-ALL cells, grey: bone (i, k). Corresponding cell tracks (red lines) for each treatment are in h, j, l. (m) Mean speed of cells at early disease and with dexamethasone, vincristine or DVA treatment (n = 91, 184, 199 and 180 cell tracks, respectively). Data pooled from seven early infiltrated, three dexamethasone, five vincristine and four DVA treated mice (biological replicates) from eight independent experiments using T-ALL from two primary donors (early infiltration and dexamethasone treatment), one primary and two secondary donors (vincristine) and one secondary donor (DVA). Cell number (n) and cell cycle analysis (o) before (D0) and after treatment (D2). Data are pooled from three mice (biological replicates) per time point, injected with T-ALL from one secondary donor. Error bars: mean±S.D.
Figure 4
Figure 4. T-ALL rapidly remodels the endosteal niche
(a) 9-hour time-lapse of Col2.3GFP mice calvaria (green: GFP+ osteoblasts) transplanted with tomato+ bone marrow (red) >8 weeks earlier (upper panels) or DsRed+ T-ALL blasts 19 days earlier (lower panels). Arrows: osteoblastic membrane blebbing. (b) Representative tilescans of Col2.3-GFP recipients during steady state haematopoiesis (left) or in malignant state (>22 days T-ALL, right). Bottom panels: high-magnification of boxed areas. Grey: bone; green: osteoblasts; blue: vasculature. Data representative of five healthy and malignant mice. (c)Bone sections from Col2.3GFP mice stained for TUNEL or cleaved caspase-3. DNAse pre-treated sections (top) were TUNEL positive control. Grey: bone; green: GFP; blue: TUNEL/DAPI; purple: cleaved caspase-3; arrows: apoptotic osteoblasts; asterisks: surviving osteoblasts. Representative from three heavily infiltrated mice (biological replicates) injected with T-ALL from two primary donors. (d) Quantified osteoblast volume from tilescans shown in (b). (e) Quantified nestin volume in Nestin-GFP+ mice 22-25 days post T-ALL transplant. a, b, d e: n = 6/5 mice (biological replicates) from three independent experiments and T-ALL from two primary donors. (f) Osterix-GFP+ cells quantified by flow cytometry in mice transplanted with murine and human T-ALL primary cells, at high tumour burden. n = 7 control mice, 5 mice with murine T-ALL from two primary donors and 6 mice with primary human T-ALL from two independent donors. (g) BM trephine biopsies from healthy or T-ALL patients immunostained for osteocalcin (brown). Data shown are representative of three healthy controls and four T-ALL patients (biological replicates) with >75% BM blast infiltration. Error Bars = mean±SEM.

Comment in

  • T-ALL: several homes rather than homeless?
    Rak J, Méndez-Ferrer S. Rak J, et al. Immunol Cell Biol. 2017 Jan;95(1):1-2. doi: 10.1038/icb.2016.103. Epub 2016 Nov 8. Immunol Cell Biol. 2017. PMID: 27824040 No abstract available.

References

    1. Bowers M, et al. Osteoblast ablation reduces normal long-term hematopoietic stem cell self-renewal but accelerates leukemia development. Blood. 2015;125:2678–2688. doi: 10.1182/blood-2014-06-582924. - DOI - PMC - PubMed
    1. Colmone A, et al. Leukemic cells create bone marrow niches that disrupt the behavior of normal hematopoietic progenitor cells. Science. 2008;322:1861–1865. doi: 10.1126/science.1164390. - DOI - PubMed
    1. Duan CW, et al. Leukemia propagating cells rebuild an evolving niche in response to therapy. Cancer cell. 2014;25:778–793. doi: 10.1016/j.ccr.2014.04.015. - DOI - PubMed
    1. Hanoun M, et al. Acute myelogenous leukemia-induced sympathetic neuropathy promotes malignancy in an altered hematopoietic stem cell niche. Cell stem cell. 2014;15:365–375. doi: 10.1016/j.stem.2014.06.020. - DOI - PMC - PubMed
    1. Ishikawa F, et al. Chemotherapy-resistant human AML stem cells home to and engraft within the bone-marrow endosteal region. Nature biotechnology. 2007;25:1315–1321. doi: 10.1038/nbt1350. - DOI - PubMed

Publication types

LinkOut - more resources