. 2016 Oct 17;14(1):90.
doi: 10.1186/s12915-016-0304-z.

Morphological and Transcriptomic Analysis of a Beetle Chemosensory System Reveals a Gnathal Olfactory Center

Affiliations

Morphological and Transcriptomic Analysis of a Beetle Chemosensory System Reveals a Gnathal Olfactory Center

Stefan Dippel et al. BMC Biol. .

Abstract

Background: The red flour beetle Tribolium castaneum is an emerging insect model organism representing the largest insect order, Coleoptera, which encompasses several serious agricultural and forest pests. Despite the ecological and economic importance of beetles, most insect olfaction studies have so far focused on dipteran, lepidopteran, or hymenopteran systems.

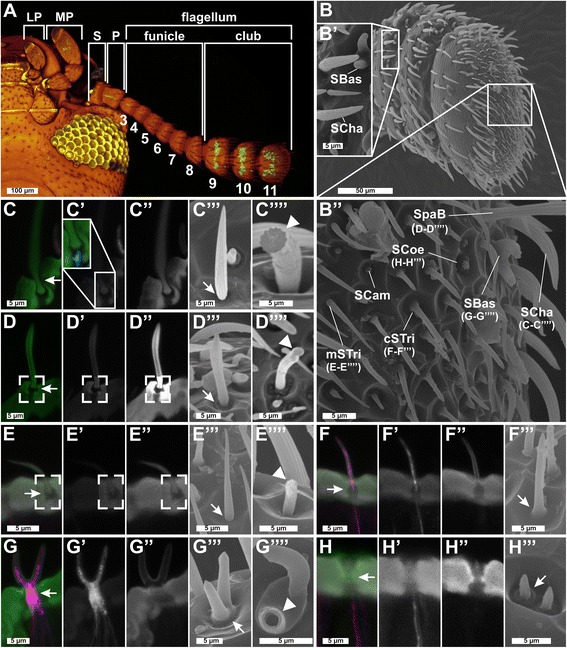
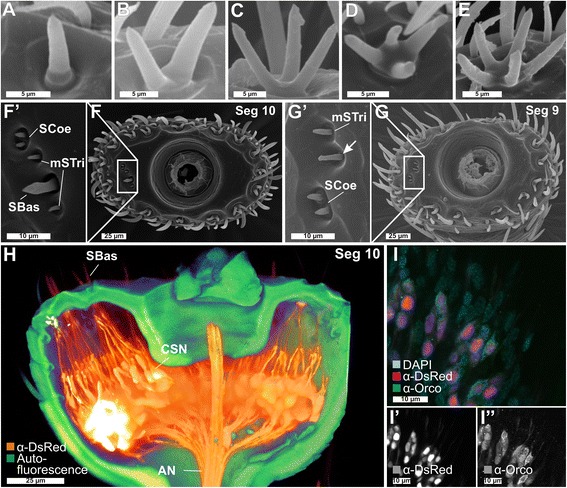
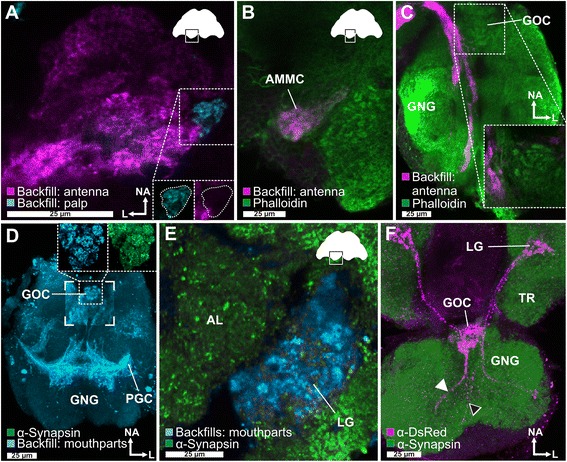
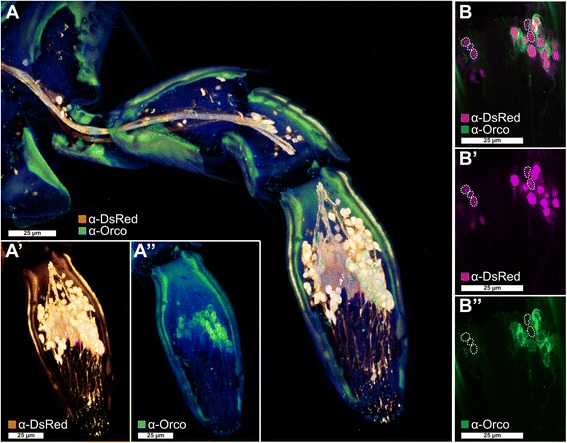
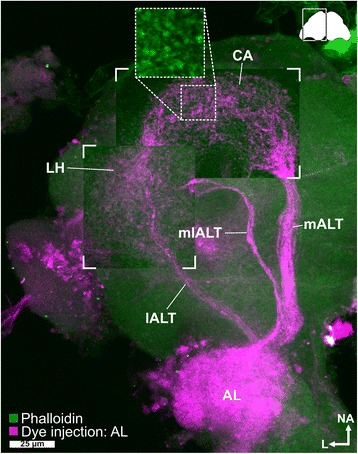
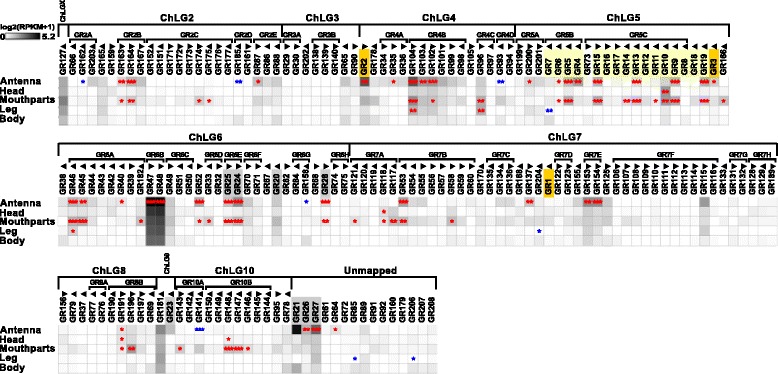
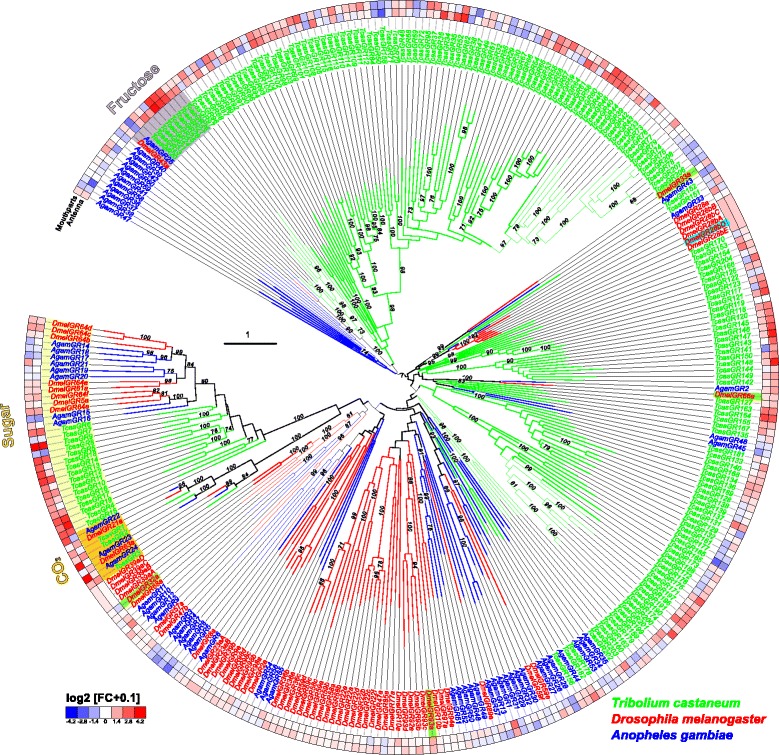
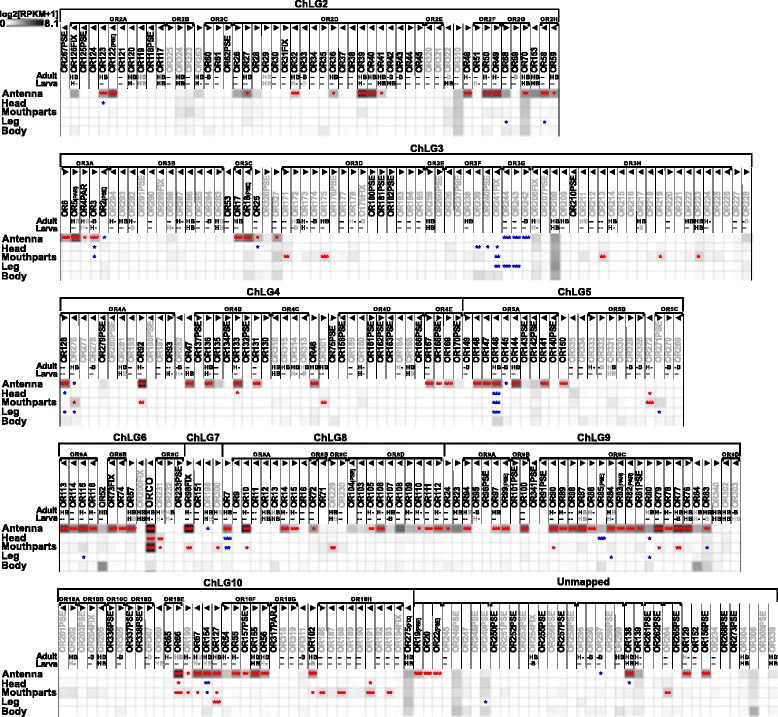
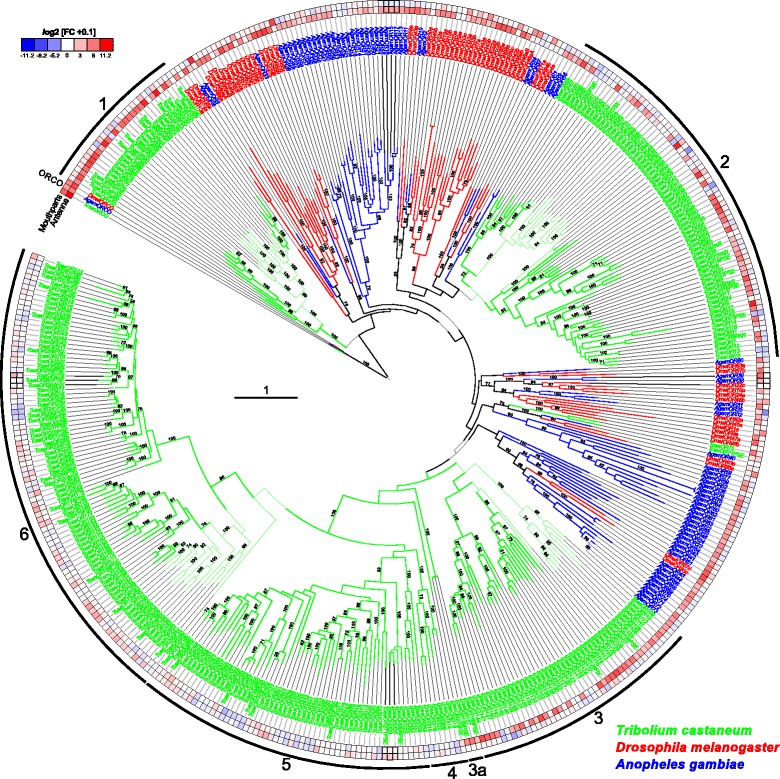
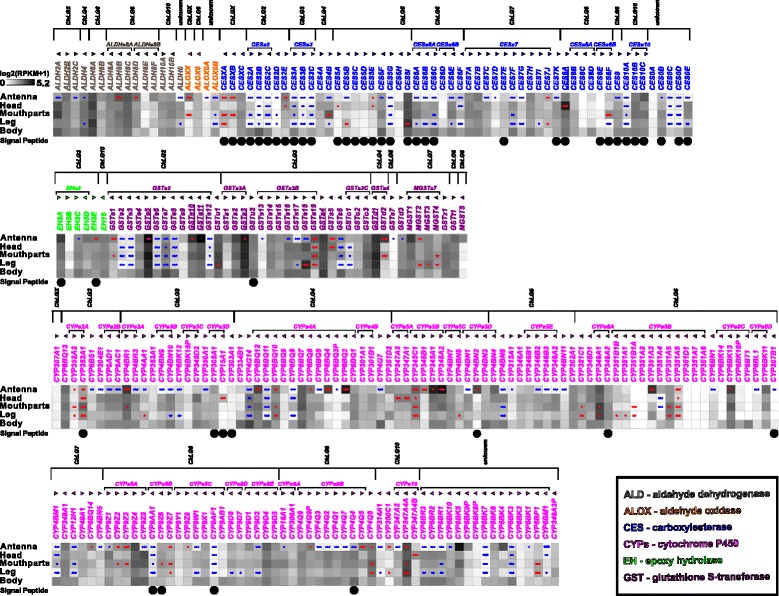
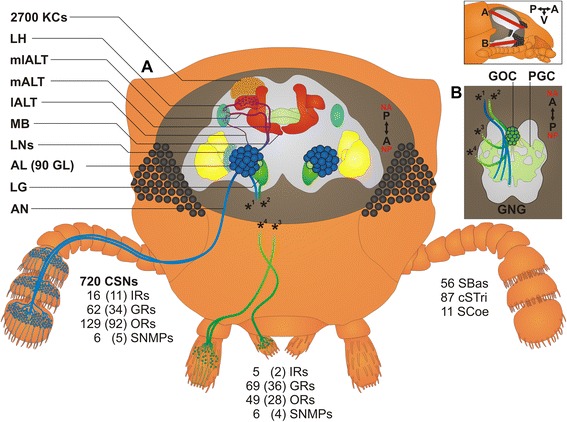
Results: Here, we present the first detailed morphological description of a coleopteran olfactory pathway in combination with genome-wide expression analysis of the relevant gene families involved in chemoreception. Our study revealed that besides the antennae, also the mouthparts are highly involved in olfaction and that their respective contribution is processed separately. In this beetle, olfactory sensory neurons from the mouthparts project to the lobus glomerulatus, a structure so far only characterized in hemimetabolous insects, as well as to a so far non-described unpaired glomerularly organized olfactory neuropil in the gnathal ganglion, which we term the gnathal olfactory center. The high number of functional odorant receptor genes expressed in the mouthparts also supports the importance of the maxillary and labial palps in olfaction of this beetle. Moreover, gustatory perception seems equally distributed between antenna and mouthparts, since the number of expressed gustatory receptors is similar for both organs.

Conclusions: Our analysis of the T. castaneum chemosensory system confirms that olfactory and gustatory perception are not organotopically separated to the antennae and mouthparts, respectively. The identification of additional olfactory processing centers, the lobus glomerulatus and the gnathal olfactory center, is in contrast to the current picture that in holometabolous insects all olfactory inputs allegedly converge in the antennal lobe. These findings indicate that Holometabola have evolved a wider variety of solutions to chemoreception than previously assumed.

Keywords: Tribolium castaneum; chemoreception; gustation; insect; lobus glomerulatus; neuroanatomy; olfaction.


Figures

Fig. 1
Fig. 1
Sensilla types and distribution on Tribolium castaneum antennae I. a Chemosensory sensilla are restricted to the distal three segments (9–11) of the T. castaneum antenna, which is composed of scape (S), pedicel (P), and flagellum, and the last labial palp (LP) and maxillary palp (MP) segment. CLSM-stack voltex projection of a transgenic beetle head (ventral view, green: partial Orco-Gal4/UAS-tGFP; yellowish eye, brownish cuticle: autofluorescence). bb'' SEM images of the club segments with close-up of segments 9 (b') and 11 (b''). Single sensilla: CLSM maximum intensity projection overlays (ch) of antibody-enhanced EF1-B-DsRed reporter signal (magenta, c'–h') and cuticle autofluorescence (green, c''–h''). c'''–h''' SEM analysis. Mechanoreceptive sensilla: SCam are small, smooth, and dome-shaped sensilla restricted to segment 11 (Additional file 3: Figure S3a); SCha – previously described as spines [90] – are longitudinally corrugated, connected to a neuron at the socket (c'; blue), jointed (c'''; arrow), and solid (c''''; arrowhead). dd'''' SpaB – in T. brevicornis called sensilla squamiformium [95] – resemble modified (slightly thicker tip) SCha [96] restricted to segment 11 (Additional file 3: Figure S3b). ee'''' mSTri (structurally similar to SCha but smaller more hair-like appearance) have previously been described in other species [24, 244]. CLSM analysis showed joint-like structures at the base (ce, c''–e'', open squares) of the mechanoreceptive sensilla and SEM revealed a small gap at their base (c'''–e''', arrow). Chemoreceptive sensilla: ff''' cSTri are hair-like structures restricted to segment 11 (Additional file 3: Figure S3d) with a rounded tip and a smooth transition of the base; gg'''' SBas are smooth-surfaced pegs with rounded tips and smooth transitions at the base (g'''; arrow). hh''' SCoe are short and corrugated, and their transition into the antennal cuticle shows a typical elevation (b'', h'''). All chemoreceptive sensilla (f, g, f'–h') house dendritic branches of CSNs labeled by DsRed. The close-up in c' shows a non-CSN fiber entering only the base of a SCha labeled with phalloidin (blue). Chemoreceptive sensilla show a smooth transition into the antennal cuticle (f'''–h''', arrow). Whereas all mechanoreceptive sensilla are solid cuticular structures (fractured in c''''–e''''), chemoreceptive SBas appear hollow (fractured in g''''). CLSM confocal laser-scanning microscopy, CSN chemosensory neuron, cSTri chemosensilla trichoidea, LP labial palp, MP maxillary palp, mSTri mechanosensilla trichoidea, P pedicel, S scape, SBas sensilla basiconica, SCam sensilla campaniformes, SCha sensilla chaetica, SCoe sensilla coeloconica, SEM scanning electron microscopy, SpaB spaculate bristle
Fig. 2
Fig. 2
Sensilla types and distribution on Tribolium castaneum antennae II. ae SEM images of SBas with one to five prongs. f, f' SEM image of the tenth segment of the antenna with a close-up of the lateral corner (f') containing SCoe, SBas, and mSTri. g, g' SEM image of the ninth segment with a close-up of the lateral corner (g') showing SCoe and mSTri. Chemoreceptive SCoe were previously described as “minute spicule-like sensilla trichoidea” [90], are relatively rare (Additional file 3: Figure S3e), and located besides the lateral corners of segments 9 and 10 (f',g') mostly at the apical side of segment 11 (Fig. 1b''). Chemoreceptive SBas are arranged in an axial ring at the distal margins of all three club segments (f, g, Fig. 1b–b''). For mechanoreceptive mSTri, we identified about 37 on the apical side of segment 11 (Fig. 1b'') and four in lateral corners of segments 9 and 10 (f, f', g, g', and Additional file 3: Figure S3c, h). h Voltex projection based on a CLSM image stack of the tenth segment from the EF1-B-DsRed line displaying CSNs (orange) and autofluorescence of the cuticle (green). The dendrites of the CSNs converge into the SBas (on average, six per prong), while the axons unite at the center of the segment and join the antennal nerve (AN). ii'' Overlay of the signals of the DsRed reporter (magenta, i') and the Orco antibody (green, i'') together with DAPI staining (light blue) in the EF1-B-DsRed line, demonstrating a high level of colocalization between DsRed and Orco in segments 9 and 10, but not in 11, where some DsRed-immunoreactive CSNs are spared (compare with Additional file 1: Figure S1a). AN antennal nerve, CLSM confocal laser-scanning microscopy, CSN chemosensory neuron, mSTri mechanosensilla trichoidea, Orco odorant receptor co-receptor, SBas sensilla basiconica, SCoe sensilla coeloconica, Seg segment, SEM scanning electron microscopy
Fig. 3
Fig. 3
The central olfactory pathway of T. castaneum. a Backfill of one antenna (magenta) stains all glomeruli in the ipsilateral antennal lobe (AL) except one. This glomerulus is exclusively labeled by a backfill of a maxillary palp (cyan). b In addition to the AL glomeruli, backfilling (magenta) of one antenna labeled the ipsilateral antennal mechanosensory and motor center (AMMC), located n-dorsally to the AL, c as well as descending fibers to the gnathal ganglion (GNG). d Maximum intensity projection of the backfills of mouthparts (cyan) shows massive innervation of the GNG including the gnathal olfactory center (GOC) (magnified in the inset) and the primary gustatory center (PGC). e Backfill of the mouthparts (cyan) revealed in the cerebral ganglion beside innervation of a single ipsilateral AL glomerulus also projections in the ipsilateral lobus glomerulatus (LG). f Reporter expression of the partial Orco-Gal4/UAS-DsRed line (magenta) revealed two paired input tracts (black and white arrowheads) from the maxillary (white arrowhead) and labial palps (black arrowhead) that converge in a medial and n-anterodorsally located glomerular area, the GOC, and ascend to a microglomerularly organized area, the LG. See also Additional file 7: Movie S3. Orientation bars in (a) also apply for (b) and (e). AL antennal lobe, AMMC antennal mechanosensory and motor center, GNG gnathal ganglion, GOC gnathal olfactory center, L lateral, LG lobus glomerulatus, NA neuroaxis-anterior, PGC primary gustatory center, TR tritocerebrum
Fig. 4
Fig. 4
Orco-immunoreactive sensory neurons in the maxillary palp. a Voltex projection of a CLSM-stack showing antibody enhanced reporter expression of the EF1-B-DsRed line (a', orange) and Orco-immunoreactive cells (a'', green) in a halved maxillary palp. bb'' Single optical section of (a) showing partial colocalization of Orco immunoreactivity and the reporter expression of the EF1-B-DsRed line (magenta). Dotted lines in (b) highlight reporter-expressing cells that are not Orco-immunoreactive. CLSM confocal laser-scanning microscopy, Orco odorant receptor co-receptor
Fig. 5
Fig. 5
Antennal lobe tracts. Maximum intensity projection of a CLSM image stack after dye injection into the AL (magenta) revealed three antennal lobe tracts – the medial (mALT), mediolateral (mlALT), and the lateral antennal lobe tract (lALT) – as well as the calyx (CA) and the lateral horn (LH). In the CA, most fibers from the mALT form microglomeruli (inset obtained from another preparation). The staining in the optical lobe is an artifact caused by diffusion of the dye during application. Phalloidin counterstaining in green. AL antennal lobe, ALT antennal lobe tracts, CA calyx, CLSM confocal laser-scanning microscopy, lALT lateral antennal lobe tract, LH lateral horn, mALT mediolateral lobe tract, mlALT mediolateral lobe tract
Fig. 6
Fig. 6
Comparison of expression levels in male and female antenna. Comparison of expression levels of odorant receptors (ORs, magenta), gustatory receptors (GRs, green), ionotropic glutamate-like receptors (IRs, blue), sensory neuron membrane proteins (SNMPs, orange), orthologous of candidates obtained from D. melanogaster (Dmel candidates, grey) and potential odorant degrading enzymes (ODEs, yellow) in male and female antennae. Average values based on two male and three female antennal samples. Scatter plot of the RPKM values. Dmel D. melanogaster, GRs gustatory receptors, IRs ionotropic glutamate-like receptors, ODEs odorant degrading enzymes, ORs odorant receptors, RPKM reads per kilobase per million, SNMPs sensory neuron membrane proteins
Fig. 7
Fig. 7
Expression of T. castaneum ionotropic glutamate-like receptors (IRs). Heat map showing the expression level of the 23 IRs as a log2[RPKM + 1] value in different tissues [adult antennae, head (missing antennae but including mouthparts), mouthparts, legs, and body]. The candidates are ordered according to their chromosomal localization (Additional file 9: Figure S5b). Horizontal brackets above indicate clustering in the genome. The arrowheads represent the orientation of the open reading frame. The expression levels are represented by a greyscale with highest shown expression levels labeled black. The asterisks mark statistically significantly differentially expressed genes compared to body (based on biological replicates of five antennal, two head, three mouthpart, two leg, and two body samples). The red asterisks represent up- and the blue down-regulation (p values adjusted are * < 0.05, ** < 0.01, and *** < 0.001). IR ionotropic glutamate-like receptor, RPKM reads per kilobase per million
Fig. 8
Fig. 8
Phylogenetic tree of IRs. Based on protein sequences from T. castaneum (green branches), D. melanogaster (red branches), and An. gambiae (blue branches). The tree was rooted using the IR8/IR25 clade, according to [114]. Robustness of the tree topology was evaluated by 100 rapid bootstrap replications. Outer rings represent the expression in antennae and mouthparts (T. castaneum: palps, mandible, labrum, and labium; D. melanogaster: palp and proboscis; An. gambiae: maxillary palp) as log2-fold change compared to body corresponding to the scale in the left lower corner. The scale bars within the trees represent one amino acid substitution per site. Antennal IRs are highlighted in yellow. Basically the same figure is available with absolute values instead of fold changes to get an impression of the tissue-specific abundance of the transcripts as Additional file 10: Figure S6. IR ionotropic glutamate-like receptor
Fig. 9
Fig. 9
Expression of T. castaneum gustatory receptors (GRs). Heat map showing the expression level of the 207 analyzed GRs as a log2[RPKM + 1] value in different tissues [adult antennae, head (missing antennae but including mouthparts), mouthparts, legs, and body]. The candidates are ordered according to their chromosomal localization (Additional file 11: Figure S7b). Horizontal brackets above indicate clustering in the genome. The arrowheads represent the orientation of the open reading frame. The expression levels are represented by a greyscale with the highest shown expression levels labeled black. The asterisks mark statistically significantly differentially expressed genes compared to body (based on biological replicates of five antennal, two head, three mouthpart, two leg, and two body samples). The red asterisks represent up- and the blue down-regulation (p values adjusted are * < 0.05, ** < 0.01, and *** < 0.001). CO2 receptors are highlighted in orange, fructose receptor related genes in grey, and sugar receptors in yellow. GR gustatory receptor, RPKM reads per kilobase per million,
Fig. 10
Fig. 10
Phylogenetic tree of gustatory receptors (GRs). Mid-point rooted tree based on protein sequences from T. castaneum (green branches), D. melanogaster (red branches), and An. gambiae (blue branches). Robustness of the tree topology was evaluated by 100 rapid bootstrap replications. Outer rings represent the expression in antennae and mouthparts (T. castaneum: palps, mandible, labrum, and labium; D. melanogaster: palp and proboscis; An. gambiae: maxillary palp) as log2-fold change compared to body corresponding to the scale in the left lower corner. The scale bars within the trees represent one amino acid substitution per site. Potential sugar receptors (highlighted in yellow), fructose receptors (highlighted in grey), and CO2 receptors (highlighted in orange) are labeled. Known bitter receptors from D. melanogaster are highlighted in green, and the thermos-sensitive GR28bD in light blue. Basically the same figure is available with absolute values instead of fold changes to get an impression of the tissue-specific abundance of the transcripts as Additional file 12: Figure S8. GR gustatory receptor
Fig. 11
Fig. 11
Expression of T. castaneum odorant receptors (ORs). Heat map showing the expression levels of the 337 analyzed ORs as log2[RPKM + 1] with a maximum of 8.1 (Orco has a value of 11.1 in antenna) in different tissues [adult antennae, head (missing antennae but including mouthparts), mouthparts, legs, and body]. The candidates are ordered according to their chromosomal localization (Additional file 13: Figure S9c). Horizontal brackets above indicate clustering in the genome, and the arrowheads represent the orientation of the open reading frame. ORs that are member of clades four, five, and six [115] are written in grey letters. The line labeled with Adult and Larva refers to data from [115]. The character H (respectively B) indicates that the corresponding OR was detected in head or body cDNA samples by reverse PCR of the labeled developmental stage. A black letter indicates that an amplicon was detected in the majority of replicates, a grey letter means only in a few replicates, a dash indicates no PCR product and no character means no data available. A comparison of the number of expressed genes is summarized in Additional file 13: Figure S9b. The expression levels are represented by a greyscale with highest shown expression levels (3 RPKM or higher) labeled black to make sure that also low level expression is identifiably presented. The asterisks mark statistically significantly differentially expressed genes compared to body (based on biological replicates of five antennal, two head, three mouthpart, two leg, and two body samples). The red asterisks represent up- and the blue down-regulation (p values adjusted are * < 0.05, ** < 0.01, and *** < 0.001). B body, H head, OR odorant receptor, RPKM reads per kilobase per million
Fig. 12
Fig. 12
Phylogenetic tree of odorant receptors (ORs). Protein sequences (>300 amino acids) from T. castaneum (green branches), D. melanogaster (red branches), and An. gambiae (blue branches). The tree was rooted using the Orco clade, according to [24]. Robustness of the tree topology was evaluated by 100 rapid bootstrap replications. Outer rings represent the expression in antennae and mouthparts (T. castaneum: palps, mandible, labrum, and labium; D. melanogaster: palp and proboscis; An. gambiae: maxillary palp) as log2-fold change compared to body corresponding to the scale in the left upper corner. The surrounding numbers on the outer thin line indicate the expansion groups 1 to 6 [115]. TcasOR71 and TcasOR72PSE were previously assigned to expansion group 1. The scale bar within the tree represents one amino acid substitution per site. Basically the same figure is available with absolute values instead of fold changes to get an impression of the tissue-specific abundance of the transcripts as Additional file 14: Figure S10. OR odorant receptor
Fig. 13
Fig. 13
Expression of T. castaneum potential odorant degrading enzymes (ODEs). Heat map showing the expression level of the 263 potential ODEs as a log2[RPKM + 1] value in different tissues [adult antennae, head (missing antennae but including mouthparts), mouthparts, legs, and body]. The candidates are ordered according to their protein family and chromosomal localization. Horizontal brackets above indicate clustering in the genome (Additional file 15: Figure S11), and the arrowheads represent the orientation of the open reading frame. Underlined genes were previously found on the protein level in antennae by [89]. The expression levels are represented by a greyscale with the highest shown expression levels labeled black. The asterisks mark statistically significantly differentially expressed genes compared to body (based on biological replicates of five antennal, two head, three mouthpart, two leg, and two body samples). The red asterisks represent up- and the blue down-regulation (p values adjusted are * < 0.05, ** < 0.01, and *** < 0.001). A black dot in the lowest line indicates a predicted signal peptide according to a SignalP 4.0 [211] prediction. ODE odorant degrading enzyme, RPKM reads per kilobase per million
Fig. 14
Fig. 14
Expression of T. castaneum homologs of genes described to be involved in olfaction of D. melanogaster. Heat map showing the expression level of the several genes supposed to be involved in D. melanogaster olfaction, as a log2[RPKM + 1] value in different tissues [adult antennae, head (missing antennae but including mouthparts), mouthparts, legs, and body]. The expression levels are represented by a greyscale with highest shown expression levels labeled black. The asterisks mark statistically significantly differentially expressed genes compared to body (based on biological replicates of five antennal, two head, three mouthpart, two leg, and two body samples). The red asterisks represent up-regulation (p values adjusted are * < 0.05). RPKM reads per kilobase per million
Fig. 15
Fig. 15
Expression of T. castaneum sensory neuron membrane proteins (SNMPs). Heat map showing the expression level of the six sensory neuron membrane proteins of T. castaneum, as a log2[RPKM + 1] value in different tissues [adult antennae, head (missing antennae but including mouthparts), mouthparts, legs, body, as well as larval head and body]. The candidates are ordered according to their chromosomal localization (Additional file 9: Figure S5b). Horizontal brackets above indicate clustering in the genome, and the arrowheads represent the orientation of the open reading frame. The expression levels are represented by a greyscale with highest shown expression levels labeled black. The asterisks mark statistically significantly differentially expressed genes compared to body (based on biological replicates of five antennal, two head, three mouthpart, two leg, and two body samples). The red asterisks represent up- and the blue down-regulation (p values adjusted are * < 0.05, ** < 0.01, and *** < 0.001). SNMP sensory neuron membrane protein, RPKM reads per kilobase per million
Fig. 16
Fig. 16
T. castaneum head scheme depicting the major olfactory pathway components. a Head section (dorsal view) showing the brain and the CSNs from the antenna (blue) and the mouthparts (green). b Head section (ventral view) showing the GNG. Section orientation is indicated at the upper right corner (lateral view of the head; V, ventral). Double-headed arrows indicate body (A, anterior ↔ P, posterior; black) and neuro-axis (NA, n-anterior ↔ NP, n-posterior; red). Chemical signals are sensed by about 720 CSNs located in 56 SBas, 87 cSTri, and 11 SCoe on the last three antennal segments. These CSNs express 16 IRs, 62 GRs, 129 ORs, and six SNMPs. Chemosensory information is also perceived in the palps by five IRs, 69 GRs, 49 ORs, and six SMNPs (number in brackets indicates significantly enriched members compared to body). The antennal nerve (AN) projects into the ipsilateral AL, where all except one (light green) of the about 90 GL (dark blue) are innervated. A separate antennal tract (*1) descends into the GNG (b, blue), where presumably gustatory and mechanosensory information is processed. Incoming olfactory information is processed by a complex network of local interneurons (LNs) in the AL and further relayed by projection neurons forming three ALTs. The medial ALT (mALT) projects to and arborizes in the calyx of the MB formed by about 2700 KCs (orange) to eventually innervate the LH (light blue). The mediolateral ALT (mlALT) and lateral ALT (lALT) directly innervate the LH. From the mouthparts, CSNs project via the maxillary (*3) and labial palp nerves (*4) into the GNG, where the gustatory information is processed in the PGC. The olfactory sensory input from the palps is processed in an unpaired glomerularly organized GNG structure, the GOC, as well as in the LG, which receives input from some palpal OSNs via ascending neurons (*2) passing through the GOC. Some of the palp-derived chemosensory information is processed in the single AL glomerulus, which lacks antennal innervation and is, therefore, exclusively innervated by projections from the mouthparts (light green). AL antennal lobe, ALT antennal lobe tracts, AN antennal nerve, CSN chemosensory neuron, cSTri chemosensilla trichoidea, GL antennal lobe glomeruli, GNG gnathal ganglia, GOC gnathal olfactory center, GR gustatory receptor, IR ionotropic glutamate-like receptor, KC Kenyon cells, lALT lateral antennal lobe tract, LG lobus glomerulatus, LH lateral horn, LNs local interneurons, mALT mediolateral lobe tract, MB mushroom body, mlALT mediolateral lobe tract, OR odorant receptor, OSN, olfactory sensory neuron; PGC primary gustatory center, SBas sensilla basiconica, SCoe sensilla coeloconica, SNMP sensory neuron membrane protein

Similar articles

Cited by

References

    1. de Bruyne M, Smart R, Zammit E, Warr CG. Functional and molecular evolution of olfactory neurons and receptors for aliphatic esters across the Drosophila genus. J Comp Physiol A Neuroethol Sens Neural Behav Physiol. 2010;196:97–109. doi: 10.1007/s00359-009-0496-6. - DOI - PubMed
    1. Dahanukar A, Hallem EA, Carlson JR. Insect chemoreception. Curr Opin Neurobiol. 2005;15:423–30. doi: 10.1016/j.conb.2005.06.001. - DOI - PubMed
    1. Tegoni M, Campanacci V, Cambillau C. Structural aspects of sexual attraction and chemical communication in insects. Trends Biochem Sci. 2004;29:257–64. doi: 10.1016/j.tibs.2004.03.003. - DOI - PubMed
    1. Leal WS. Odorant reception in insects: roles of receptors, binding proteins, and degrading enzymes. Annu Rev Entomol. 2013;58:373–91. doi: 10.1146/annurev-ento-120811-153635. - DOI - PubMed
    1. Visser JH. Host odor perception in phytophagous insects. Annu Rev Entomol. 1986;31:121–44. doi: 10.1146/annurev.en.31.010186.001005. - DOI

Publication types

MeSH terms