. 2016 Nov 20;428(23):4723-4735.
doi: 10.1016/j.jmb.2016.10.017. Epub 2016 Oct 14.

Structural Dynamics in Ras and Related Proteins upon Nucleotide Switching

Affiliations

Structural Dynamics in Ras and Related Proteins upon Nucleotide Switching

Rane A Harrison et al. J Mol Biol. .

Abstract

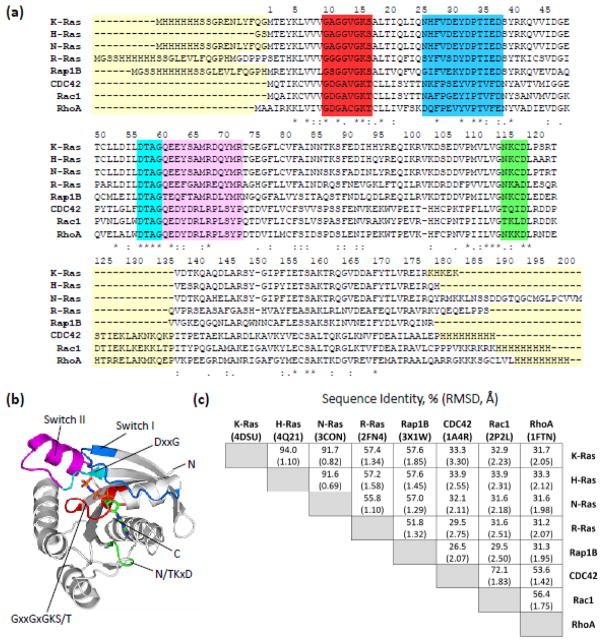
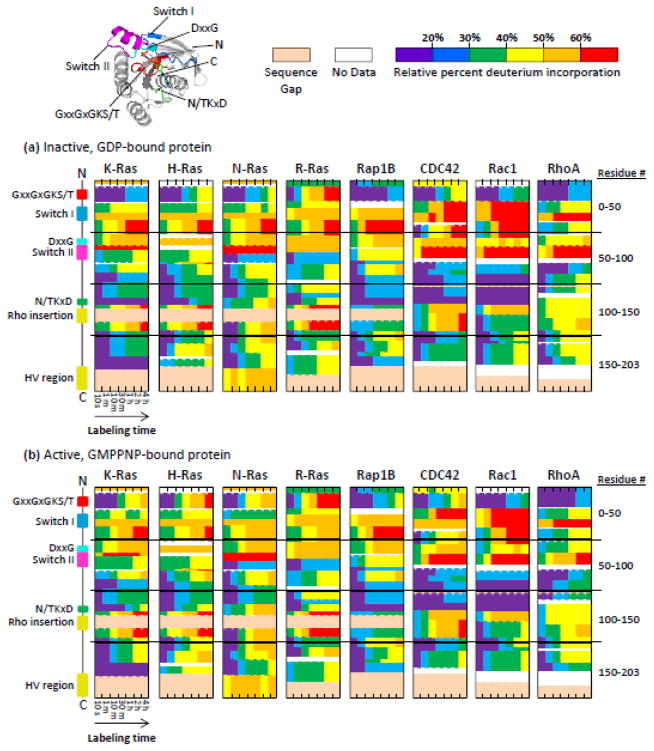
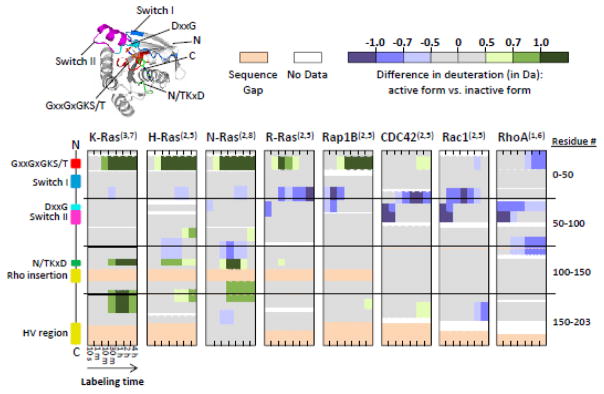
Structural dynamics of Ras proteins contributes to their activity in signal transduction cascades. Directly targeting Ras proteins with small molecules may rely on the movement of a conserved structural motif, switch II. To understand Ras signaling and advance Ras-targeting strategies, experimental methods to measure Ras dynamics are required. Here, we demonstrate the utility of hydrogen-deuterium exchange (HDX) mass spectrometry (MS) to measure Ras dynamics by studying representatives from two branches of the Ras superfamily, Ras and Rho. A comparison of differential deuterium exchange between active (GMPPNP-bound) and inactive (GDP-bound) proteins revealed differences between the families, with the most notable differences occurring in the phosphate-binding loop and switch II. The P-loop exchange signature correlated with switch II dynamics observed in molecular dynamics simulations focused on measuring main-chain movement. HDX provides a means of evaluating Ras protein dynamics, which may be useful for understanding the mechanisms of Ras signaling, including activated signaling of pathologic mutants, and for targeting strategies that rely on protein dynamics.

Keywords: Rho; guanosine diphosphate (GDP); hydrogen–deuterium exchange mass spectrometry; protein dynamics; signal transduction.


Figures

FIGURE 1
FIGURE 1
Comparison of primary and tertiary structures for the Ras superfamily proteins studied. (a) Sequences for all proteins studied, aligned using Clustal Omega [66, 67]. Residue numbering is based on N-Ras, beginning with the initiator methionine and ending at the C-terminus. Yellow boxes indicate regions of notably high dissimilarity between proteins, due either to purification tags or sequence insertions of more than one amino acid. The red box corresponds to the P-loop and the green box corresponds to the N/TKxD motif. The cyan box represents the DxxG motif, and the blue and magenta boxes correspond to switch I and switch II, respectively. (b) The crystal structure of active K-Ras (PDB: 3GFT) with the highlighted regions from the sequence alignment indicated by their respective colors. The non-hydrolysable GTP analogue is represented by sticks, with each atom colored by element. (c) Table showing how each protein compares to the others in terms of percent sequence identity and root mean square deviation of tertiary structure alignment (RMSD, in angstroms). Percent sequence identity was calculated using the entire sequence of each protein studied, excluding tags. Tertiary structural alignments were performed using the cealign function in PyMol (The PyMol Molecular Graphics System, Version 1.8 Schrödinger, LLC.), which utilizes the combinatorial extension (CE) algorithm to align backbone α-carbons. These structural alignments were performed on accepted crystal structures of the inactive variants of each protein, with PDB codes detailed in parentheses underneath protein names.
FIGURE 2
FIGURE 2
Relative percent deuterium incorporation of (a) inactive, GDP-bound and (b) active, GMPPNP-bound Ras proteins. Peptic peptides where deuterium incorporation was measured run vertically from N- to C-terminus, with horizontal lines delineating blocks of 50 residues. Labeling time increases from left to right, as shown. Each box is colored according to the deuterium scale at the top right. The locations of key structural motifs are shown at the left (aligned to each box) and highlighted on the crystal structure of active K-Ras (PDB: 3GFT) in the upper left corner. Regions of a given protein represented in light beige indicate sequence gaps, or locations in the sequence where at least one other protein studied (besides the given protein of interest) contains an insertion of one or more amino acid residues.
FIGURE 3
FIGURE 3
Raw difference (in Da) between active, GMPPNP-bound and inactive, GDP-bound Ras proteins. From top to bottom, each visual shows the protein of interest from N- to C-terminus, with labeling time increasing from left to right. The superscript numbers in parentheses to the right of each protein name indicate the number of biological replicates (uniquely expressed and purified protein preparations) and the total number of labeling replicates analyzed, respectively, for that particular protein. The visual on the far left indicates the locations of key structural motifs, which are also highlighted on the crystal structure of active K-Ras (PDB: 3GFT) in the upper left corner. Gaps in coverage indicate regions of protein for which there was no peptide coverage and therefore no data were generated. Sequence gaps, represented in light beige, indicate regions where at least one protein had an insertion of one or more amino acids that other proteins did not share.
FIGURE 4
FIGURE 4
The total differences in deuterium incorporation for each protein highlighted on the respective crystal structure of that protein (PDB codes as indicated). For a given region, the total difference in deuterium incorporation is the sum of the individual differences at each time point for that region. The crystal structures of these proteins are organized using a phylogenetic tree, generated using Clustal Omega in conjunction with DrawTree [64, 65], which is shown in the middle. At the top, key conserved structural motifs are shown using this linear representation as well as highlighted on the crystal structure of active K-Ras (PDB: 3GFT).
FIGURE 5
FIGURE 5
Analysis of Ras proteins by MD Simulation. The root mean square fluctuation (RMSF) is used to characterize local changes along protein backbone residues whose positions are shown on the x axis. Changes in RMSF (ΔRMSF, in Å) are calculated from left to right to indicate the difference between GTP- and GDP-bound states for each protein. The switch II region is highlighted in red for plots showing RMSF and green in ΔRMSF.

References

    1. Laufs U, Liao JK. Targeting Rho in cardiovascular disease. Circ Res. 2000;87:526–8. - PubMed
    1. Seabra MC, Mules EH, Hume AN. Rab GTPases, intracellular traffic and disease. Trends Mol Med. 2002;8:23–30. - PubMed
    1. Linseman DA, Loucks FA. Diverse roles of Rho family GTPases in neuronal development, survival, and death. Front Biosci. 2007;13:657–76. - PubMed
    1. Bos JL. Ras oncogenes in human cancer: a review. Cancer Res. 1989;49:4682–9. - PubMed
    1. Schubbert S, Shannon K, Bollag G. Hyperactive Ras in developmental disorders and cancer. Nat Rev Cancer. 2007;7:295–308. - PubMed

Publication types

LinkOut - more resources