. 2016 Dec:153:110-121.
doi: 10.1016/j.exer.2016.10.013. Epub 2016 Oct 15.

The Alzheimer's-related amyloid beta peptide is internalised by R28 neuroretinal cells and disrupts the microtubule associated protein 2 (MAP-2)

Affiliations

The Alzheimer's-related amyloid beta peptide is internalised by R28 neuroretinal cells and disrupts the microtubule associated protein 2 (MAP-2)

George Taylor-Walker et al. Exp Eye Res. 2016 Dec.

Abstract

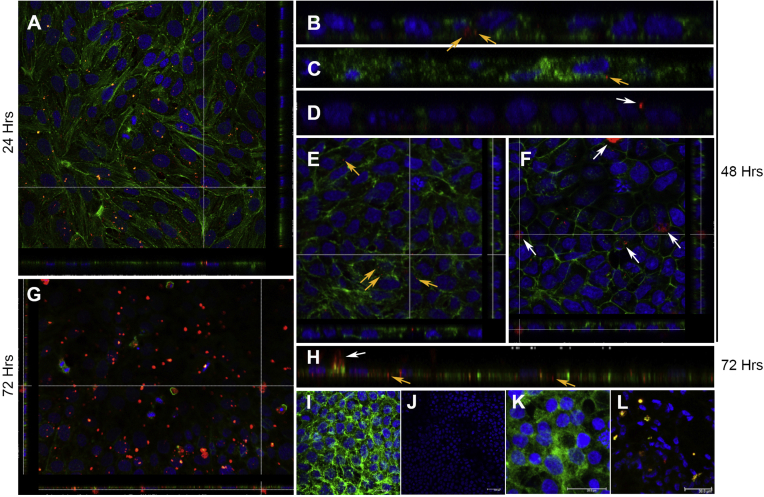
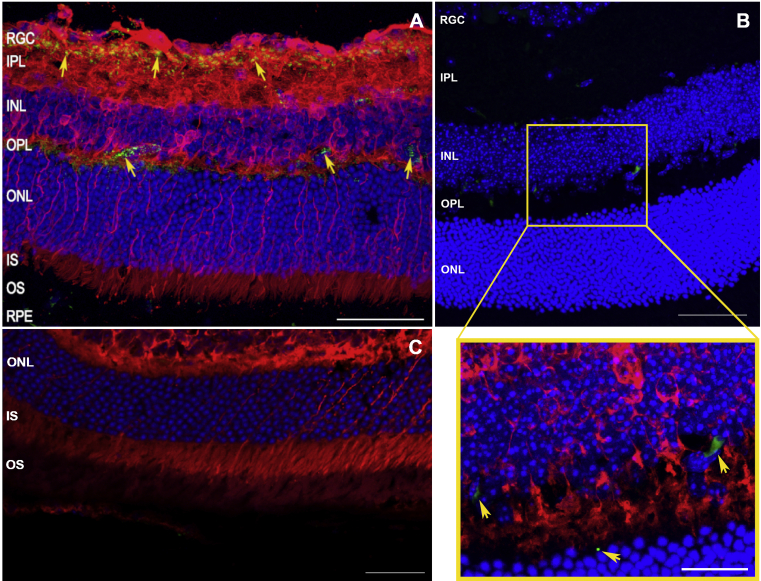
Age-related Macular Degeneration (AMD) is a common, irreversible blinding condition that leads to the loss of central vision. AMD has a complex aetiology with both genetic as well as environmental risks factors, and share many similarities with Alzheimer's disease. Recent findings have contributed significantly to unravelling its genetic architecture that is yet to be matched by molecular insights. Studies are made more challenging by observations that aged and AMD retinas accumulate the highly pathogenic Alzheimer's-related Amyloid beta (Aβ) group of peptides, for which there appears to be no clear genetic basis. Analyses of human donor and animal eyes have identified retinal Aβ aggregates in retinal ganglion cells (RGC), the inner nuclear layer, photoreceptors as well as the retinal pigment epithelium. Aβ is also a major drusen constituent; found correlated with elevated drusen-load and age, with a propensity to aggregate in retinas of advanced AMD. Despite this evidence, how such a potent driver of neurodegeneration might impair the neuroretina remains incompletely understood, and studies into this important aspect of retinopathy remains limited. In order to address this we exploited R28 rat retinal cells which due to its heterogeneous nature, offers diverse neuroretinal cell-types in which to study the molecular pathology of Aβ. R28 cells are also unaffected by problems associated with the commonly used RGC-5 immortalised cell-line, thus providing a well-established model in which to study dynamic Aβ effects at single-cell resolution. Our findings show that R28 cells express key neuronal markers calbindin, protein kinase C and the microtubule associated protein-2 (MAP-2) by confocal immunofluorescence which has not been shown before, but also calretinin which has not been reported previously. For the first time, we reveal that retinal neurons rapidly internalised Aβ1-42, the most cytotoxic and aggregate-prone amongst the Aβ family. Furthermore, exposure to physiological amounts of Aβ1-42 for 24 h correlated with impairment to neuronal MAP-2, a cytoskeletal protein which regulates microtubule dynamics in axons and dendrites. Disruption to MAP-2 was transient, and had recovered by 48 h, although internalised Aβ persisted as discrete puncta for as long as 72 h. To assess whether Aβ could realistically localise to living retinas to mediate such effects, we subretinally injected nanomolar levels of oligomeric Aβ1-42 into wildtype mice. Confocal microscopy revealed the presence of focal Aβ deposits in RGC, the inner nuclear and the outer plexiform layers 8 days later, recapitulating naturally-occurring patterns of Aβ aggregation in aged retinas. Our novel findings describe how retinal neurons internalise Aβ to transiently impair MAP-2 in a hitherto unreported manner. MAP-2 dysfunction is reported in AMD retinas, and is thought to be involved in remodelling and plasticity of post-mitotic neurons. Our insights suggest a molecular pathway by which this could occur in the senescent eye leading to complex diseases such as AMD.

Keywords: Amyloid beta (Aβ); MAP-2; Neuroretina; R28 cells; Retinal degeneration.


Figures

Image 1
Graphical abstract
Fig. 1
Fig. 1
The in-vitro aggregation dynamics of human Aβ1-42. Transmission electron micrographs showing aggregation of negatively stained and immunogold labelled human Aβ1-42 at 1, 1½, 3, 24 and 48 h. [A, C] Small amorphous aggregates including oligomers are visible 1-1½ h after preparation, showing heavy negative staining (yellow arrows) which were [B, D] confirmed to be Aβ by the anti-Aβ specific 82E1 and immunogold labelling (red arrows). Aβ continued to aggregate to form larger structures over time including protofibrils and mature fibrils that can be observed in [E, G and I] negative stained sections (lighter negative stain surrounding larger structures) and in corresponding [F, H and J] immunogold labelled images (patterns of electron-dense gold particles surrounding fibrillar assemblies). Not all Aβ aggregated, as some remained as discrete structures or isolated immunogold-labelled puncta [E, F], indicating a degree of heterogeneity at later time points. [K] Vehicle controls showed no negative staining or [L] electron-dense particles after incubation with immunogold secondary antibody only. Scale bars correspond to 200 nm. (For interpretation of the references to colour in this figure legend, the reader is referred to the web version of this article.)
Fig. 2
Fig. 2
Confocal immunofluorescence confirms the expression of R28 neuronal markers. R28 cultures were probed with a variety of antibodies against specific neuronal markers and then imaged by confocal immunofluorescence microscopy. [A] Brightfield image showing typical morphology of R28 neurons. [B] Expression of protein kinase Cα (red), [C] β3-tubulin (red) and calretinin (green). [D] Calretinin expression alone (green) with [E] calbindin (red) and [F] the microtubule associated protein-2 (green). [B–F] Nuclei are labelled throughout with DAPI (blue) in maximal projections of confocal z-stacks. Scale bar in [A] and [B] corresponds to 40 μm and 10 μm, respectively, while scales in other images [C–F] correspond to 30 μm. (For interpretation of the references to colour in this figure legend, the reader is referred to the web version of this article.)
Fig. 3
Fig. 3
Confocal immunofluorescence reveal Aβ internalisation in R28 cultures. Neurons were treated with either oligomeric Aβ1-42 or vehicle, and probed with anti-Aβ 82E1 followed by a fluorescence secondary antibody (red). Representative confocal z-stacks reveal small punctate Aβ signals [A] 24 h and [B] 48 h after exposure, which appeared to be mainly intracellular in distribution (arrows). Abeta (red) in the top-down view [A] appear as yellow within neurons stained with phalloidin (green) with nuclear DAPI in blue. [B] Magnified orthogonal section clearly showing the intracellular localisation of such Aβ particles within neurons (arrows). [C] We also tracked Aβ by direct conjugation with an Alexa Fluor 647 motif. In cultures treated with the directly tagged Aβ (pseudo coloured red), a similar pattern of small punctate fluorescence signals were visible within neurons (arrow). Signals from small internalised Aβ [B, C] were dimmer in intensity compared to brighter signals [D] that appeared to be outside cells (arrow). PKC and nuclear DAPI [in C, D] are in green and blue, respectively. [E, F] Top-down view through confocal z-stacks with corresponding orthogonal section showing; [E] small internalised Aβ (yellow arrows) within cells, and [F] larger Aβ clusters (white arrows) appear to be outside cells 48 h after exposure. Phalloidin and nuclear/DAPI can be seen coloured green and blue, respectively. [G] The propensity of Aβ tagged fluorescence signals (red) to seemingly aggregate outside neurons appear to have increased by 72 h as shown by confocal z-stacks. [H] Magnified orthogonal section at 72 h showing a mixture of small internalised Aβ (yellow arrows) which remained unchanged in size (compare with B-C at earlier time points), vs. larger fluorescence signals from apparently extracellular Aβ (white arrow). [I, J] Maximal intensity projections of representative cultures treated with vehicle control and secondary antibody only (red). Cultures were stained with [I] phalloidin (green) and [J] without phalloidin demonstrates absence of non-specific signals. Nuclear/DAPI appears in blue. [K] Maximal intensity projection showing cultures not treated with tagged Aβ1-42-Alexa Fluor 647 (pseudo red) were devoid of any signals. PCK and nuclear/DAPI appear in green and blue, respectively. [L] Cultures treated with Aβ1-42-Alexa Fluor 647 (pseudo red) which co-localised with anti-Aβ 82E1 (green) to appear yellow, indicating that all Alexa Fluor tags were positive for Aβ. Nuclear/DAPI appears in blue. Scale bars corresponds to [I] 10 μm, [K] 20 μm and [J, L] 30 μm, respectively. (For interpretation of the references to colour in this figure legend, the reader is referred to the web version of this article.)
Fig. 4
Fig. 4
MAP-2 becomes transiently impaired to by Aβ. Neurons were treated with either oligomeric Aβ1-42 or vehicle only. Potential effects on MAP-2 were assessed by confocal immunofluorescence microscopy at different time points. [A-B] Representative images show that 24 h after exposure, MAP-2 fluorescence intensity appeared to be considerably diminished in Aβ treated cultures compared to controls. This appeared to be transient as no obvious effects were observed between Aβ vs. vehicle treated cultures at [C, D] 48 h and [E-F] 72 h. Scale bars correspond to 30 μm. MAP-2 fluorescence intensity (green) was quantified blindly in images taken randomly across different time points in at least 3 separate experiments. [G] 24 h after Aβ exposure, average fluorescence values in maximal intensity projections were 15.9, SEM ± 2.1 (n = 6) vs. 23.9, SEM ± 1.29 (n = 4) in vehicle treated cultures. [H] Similar measurements taken 48 h after cells were treated with Aβ were 29.7, SEM ± 1.8 (n = 3) vs. 28.0, SEM ± 1.4 (n = 3) in vehicle only cultures, and [I] after 72 h 24.8, SEM ± 3.4 (n = 3) in Aβ treated vs. 24.9, SEM ± 0.9 (n = 3) in vehicle treated cultures. Error bars represents the standard error of the mean (SEM). Statistical significance (p < 0.05 denoted by *) was evident only at 24 h. (For interpretation of the references to colour in this figure legend, the reader is referred to the web version of this article.)
Fig. 5
Fig. 5
Experimentally introduced Aβ deposit as discrete focal aggregates in the neuroretina. In order to assess whether physiological amounts of Aβ can deposit in living retinas, C57BL/6 mice were subretinally injected with 625 nM of human Aβ1-42 or vehicle control. Retinal cross-sections were examined blindly in at least 3 separate animals (n = 10 Aβ injected eyes, and n = 3 vehicle control eyes) by confocal-immunofluorescence after 8 days. Representative images from at least 20 confocal z-stacks consistently show [A-B] Aβ deposits in RGC, inner nuclear and outer plexiform layers (arrows) as visualised by anti-Aβ 82E1 coupled to a secondary fluorescence antibody (green). β3-tubulin and nuclear DPAI appear red and blue, respectively. [B] The red channel (β3-tubulin staining) was removed to highlight focal Aβ deposits (green) within an enlarged section (yellow box), which shows a detailed image of retinal Aβ aggregates (arrows). Scale bars in A, B corresponds to 50 μm, whilst the scale bar in magnified insert is 20 μm [C] Eyes injected with vehicle only lacked Aβ immunoreactivity. β3-tubulin and nuclear DPAI appear red and blue, respectively. The scale bar corresponds to 50 μm. (For interpretation of the references to colour in this figure legend, the reader is referred to the web version of this article.)

References

    1. Al-Hilaly Y.K., Williams T.L., Stewart-Parker M., Ford L., Skaria E., Cole M., Bucher W.G., Morris K.L., Sada A.A., Thorpe J.R., Serpell L.C. A central role for dityrosine crosslinking of amyloid-beta in Alzheimer's disease. Acta Neuropathol. Commun. 2013;1:83. - PMC - PubMed
    1. Anderson D.H., Talaga K.C., Rivest A.J., Barron E., Hageman G.S., Johnson L.V. Characterization of beta amyloid assemblies in drusen: the deposits associated with aging and age-related macular degeneration. Exp. Eye Res. 2004;78:243–256. - PubMed
    1. Benilova I., Karran E., De S.B. The toxic Abeta oligomer and Alzheimer's disease: an emperor in need of clothes. Nat. Neurosci. 2012;15:349–357. - PubMed
    1. Bird A.C., Phillips R.L., Hageman G.S. Geographic atrophy: a histopathological assessment. JAMA Ophthalmol. 2014;132:338–345. - PMC - PubMed
    1. Bodur E., Layer P.G. Counter-regulation of cholinesterases: differential activation of PKC and ERK signaling in retinal cells through BChE knockdown. Biochimie. 2011;93:469–476. - PubMed