. 2017 Jan 15;145(Pt A):44-57.
doi: 10.1016/j.neuroimage.2016.09.035. Epub 2016 Oct 14.

Hippocampal to basal forebrain transport of Mn2+ is impaired by deletion of KLC1, a subunit of the conventional kinesin microtubule-based motor

Affiliations

Hippocampal to basal forebrain transport of Mn2+ is impaired by deletion of KLC1, a subunit of the conventional kinesin microtubule-based motor

Christopher S Medina et al. Neuroimage. .

Abstract

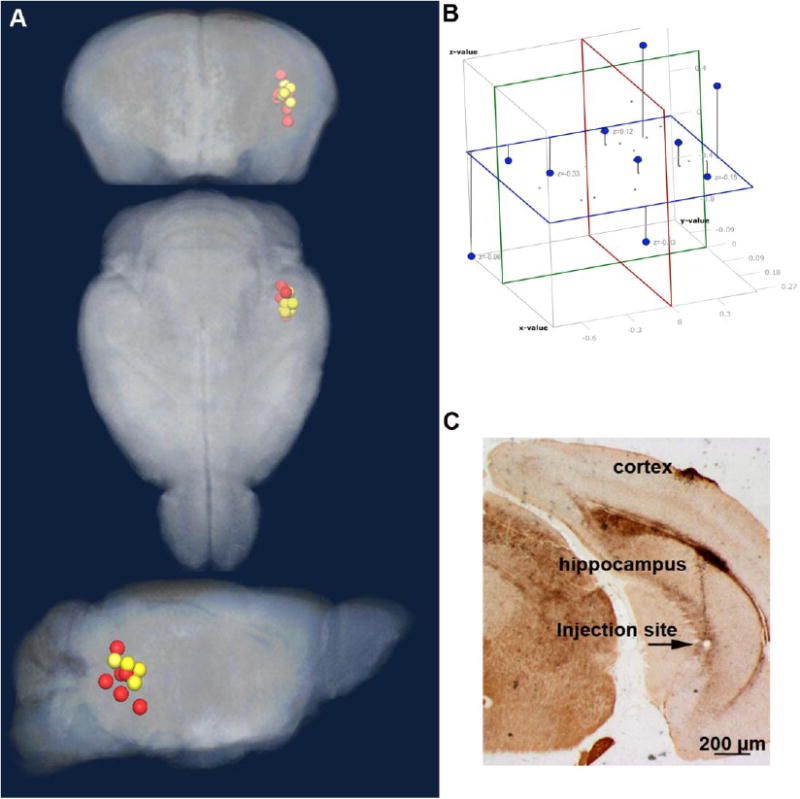
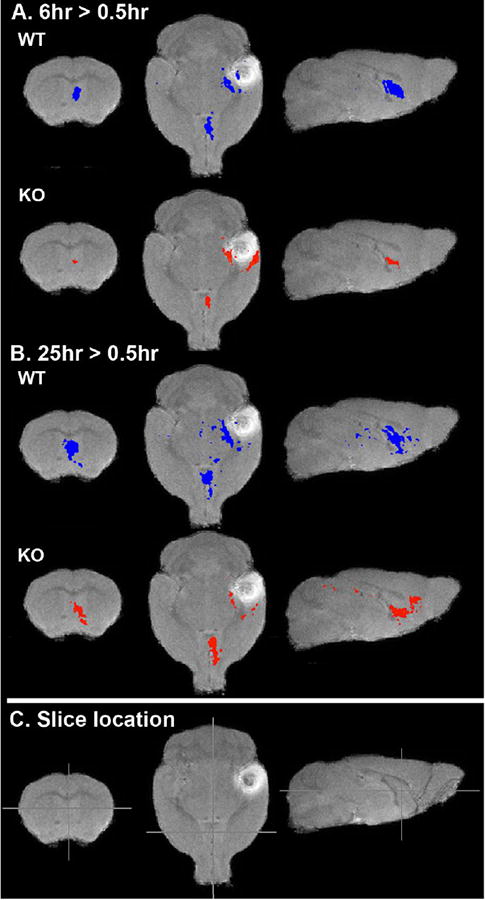
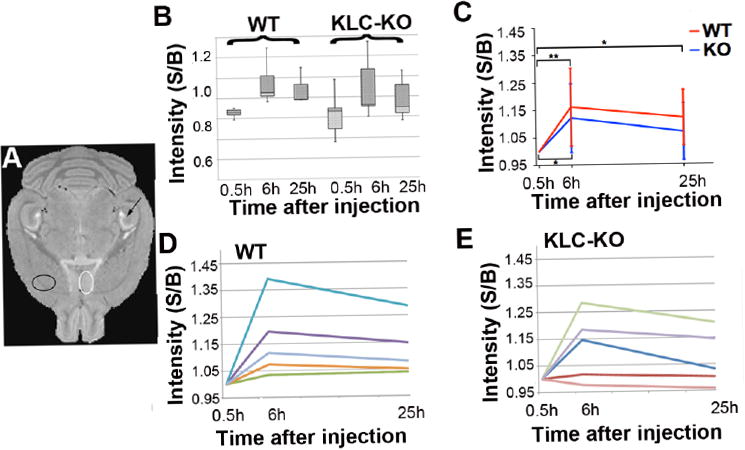
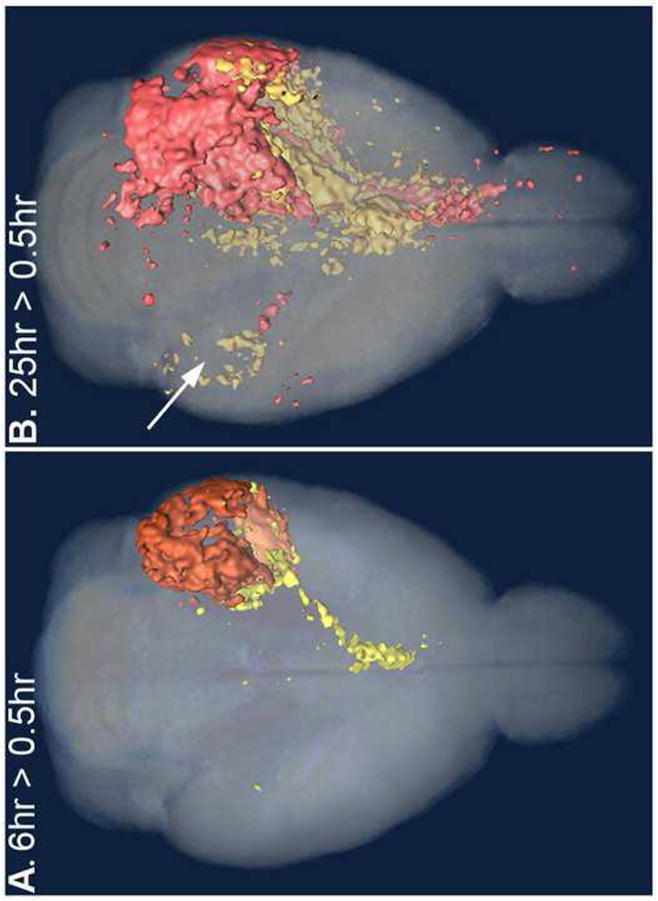
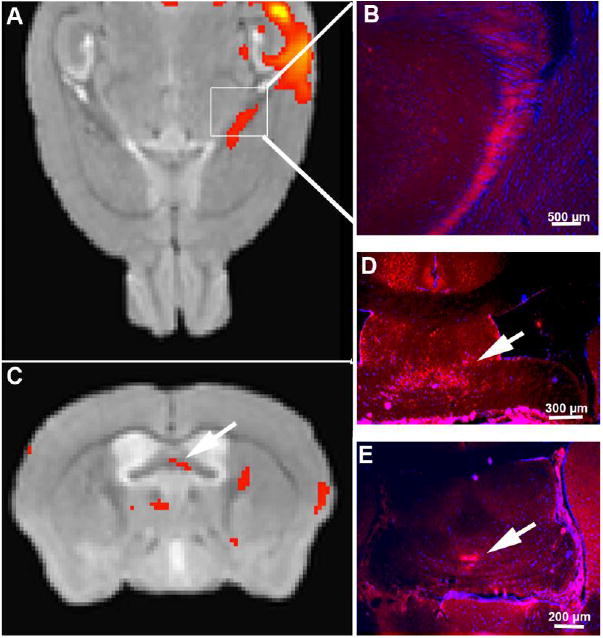
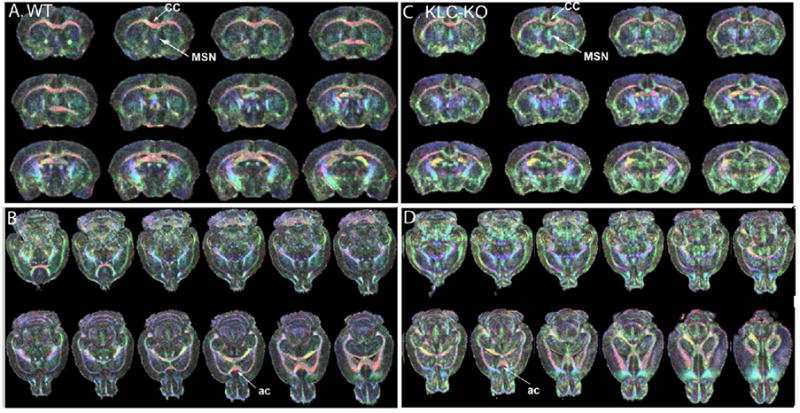
Microtubule-based motors carry cargo back and forth between the synaptic region and the cell body. Defects in axonal transport result in peripheral neuropathies, some of which are caused by mutations in KIF5A, a gene encoding one of the heavy chain isoforms of conventional kinesin-1. Some mutations in KIF5A also cause severe central nervous system defects in humans. While transport dynamics in the peripheral nervous system have been well characterized experimentally, transport in the central nervous system is less experimentally accessible and until now not well described. Here we apply manganese-enhanced magnetic resonance (MEMRI) to study transport dynamics within the central nervous system, focusing on the hippocampal-forebrain circuit, and comparing kinesin-1 light chain 1 knock-out (KLC-KO) mice with age-matched wild-type littermates. We injected Mn2+ into CA3 of the posterior hippocampus and imaged axonal transport in vivo by capturing whole-brain 3D magnetic resonance images (MRI) in living mice at discrete time-points after injection. Precise placement of the injection site was monitored in both MR images and in histologic sections. Mn2+-induced intensity progressed along fiber tracts (fimbria and fornix) in both genotypes to the medial septal nuclei (MSN), correlating in location with the traditional histologic tract tracer, rhodamine dextran. Pairwise statistical parametric mapping (SPM) comparing intensities at successive time-points within genotype revealed Mn2+-enhanced MR signal as it proceeded from the injection site into the forebrain, the expected projection from CA3. By region of interest (ROI) analysis of the MSN, wide variation between individuals in each genotype was found. Despite this statistically significant intensity increases in the MSN at 6h post-injection was found in both genotypes, albeit less so in the KLC-KO. While the average accumulation at 6h was less in the KLC-KO, the difference between genotypes did not reach significance. Projections of SPM T-maps for each genotype onto the same grayscale image revealed differences in the anatomical location of significant voxels. Although KLC-KO mice had smaller brains than wild-type, the gross anatomy was normal with no apparent loss of septal cholinergic neurons. Hence anatomy alone does not explain the differences in SPM maps. We conclude that kinesin-1 defects may have only a minor effect on the rate and distribution of transported Mn2+ within the living brain. This impairment is less than expected for this abundant microtubule-based motor, yet such defects could still be functionally significant, resulting in cognitive/emotional dysfunction due to decreased replenishments of synaptic vesicles or mitochondria during synaptic activity. This study demonstrates the power of MEMRI to observe and measure vesicular transport dynamics in the central nervous system that may result from or lead to brain pathology.

Keywords: Axonal transport; Hippocampal-forebrain circuit; Kinesin light chain-1; Kinesin-1; Manganese-enhanced magnetic resonance imaging (MEMRI); Statistical parametric mapping.


Figures

Figure 1
Figure 1. Injection site analysis
A. The location of the injection site determined from analysis of the aligned MR images is shown as projected onto the pre-injection atlas three dimensional image. Wild-type (WT) littermates (yellow); KLC-KO (red). B. To measure the distance between all sites in the dataset, a 3D coordinate system was developed. The average position in the x,y,z axes of all injection sites shown as a Cartesian coordinate system, with x plane (blue), y plane (green), z plane (red). C. An example of histologic examination of brain sections from the same mice imaged by MR showing a tiny injection site in CA 3 of the posterior hippocampus with minimal damage, as detected in this Campbell-Switzer-stained section.
Figure 2
Figure 2. Analysis of the medial septal nuclei by histology
A and B. Shown are examples of fluorescent images of the co-injected RDA in histologic sections through the medial septal nucleus (MSN), a major projection from CA3 of the hippocampus. WT (A) and KLC-KO (B). Note that RDA signal appears qualitatively weaker in the MSN of the KLC-KO (B) than the WT (A), possibly due to decreased transport. C and D. Examples from serial sections adjacent to those in A-B also through the MSN that were stained for ChAT, a marker of cholinergic neurons. No obvious difference in numbers of these neurons is apparent in these examples. At higher magnification (not shown) no abnormal axonopathies (swellings or varicosities) were observed.
Figure 3
Figure 3. Aligned and averaged MR images across time-points within genotype
Shown are axial slices from averaged images for the pre-injection atlas, and for each time-point within genotype. Note that anatomical features are preserved in these T1-weighted images, and the injection site appears distinct, placed in the same location, and similar in size in both genotypes (red arrow). Also note that increased intensity in the medial septal nuclei (MSN) (green arrows) is brighter in wild-type than in KLC-KO at 6 hours post injection.
Figure 4
Figure 4
Within genotype comparisons of transport from the injection site to the basal forebrain in KLC-KO and their wild-type littermates at 6 hour and 25 hour greater than 0.5 hour post-injection. Shown are slices from 3D-voxel-wise statistical parametric maps of paired T-tests (T-maps) comparing voxels with significant intensity increases between time-points for each genotype as indicated. Increases at 6 hours compared to 0.5 hour post-injection (6hr > 0.5hr), and for 25 hours greater that 0.5 hour (25hr >0.5hr) are overlaid on a grayscale image of the minimal deformation atlas for WT at 0.5 hour post-injection. A. The pattern of intensity increases at 6 hours compared with 0.5 hour for each genotype (blue, wild-type littermates; red KLC-KO) p=0.0001 (uncorr.). B. Voxels with increased intensity at 25 hours greater than 0.5 hour post-injection. p=0.0001 (uncorr.) (25hr > 0.5hr). C. Cross-hairs indicate the positions of slices shown in A and B. Note that at this p value, the forebrain appears to have more signal in wild-type than KLC-KO and that signal in the KLC-KO appears to have progressed further anteriorly at 25 hours post injection.
Figure 5
Figure 5. Region of interest analysis (ROI)
A. Locations selected for ROI analysis shown on a high-resolution template image for anatomy. White circle indicates the MSN, a location with increased intensity that differed between KLC-KO and their WT littermates as observed by visual inspection of the averaged images (Figure 3) and in T-maps of within-group between time-points (Figure 4). Black circle indicates the “control” region that had no signal by SPM and lies outside the CA3-septal circuit on the contralateral side from the injection. B. Box plot shows the distribution of background-corrected intensities in the MSN of WT and KLC-KO mice at each time-point. Data has been normalized. S/B = ratio of signal to background. C. Average intensities are shown for background-corrected, equalized data at each time-point in the WT (red) and in KLC-KO (blue). Intensity measurements were background-corrected and equalized by setting the 0.5 hour signal/background to 1.0. Error bars indicate standard deviation of the WT at 6 hours and 25 hours. Mixed model ANOVA with Tukey’s post-hoc analysis was used to determine significance within genotype between time-points on this corrected/equalized data. One asterisk indicates p<0.05; two asterisks indicate p<0.01. S/B = ratio of signal to background. D. and E. Line graphs showing intensity increases in background-corrected, equalized measurements over time for each animal. Each individual is represented by a different color. D, wild type (WT); and E, KLC-KO. S/B = ratio of signal to background.
Figure 6
Figure 6
Anatomical comparison of statistical parametric maps from wild-type and knock-out at each time-point superimposed in 3D renderings. These are axial projections of 3D images, with all significant voxels within the full thickness of the brain displayed. Two different T-maps between time-points within each genotype are superimposed on the same 3D grayscale image to enable comparison of the anatomical position of the Mn2+ signal. T-Map of WT (yellow) and KLC-KO (orange). Color intensities are affected by their depth and overlap in the original 3D image used for these projections. See Supplemental Video S1 and S2 to view these images in 3D. A. At 6 hours greater than 0.5 hour (6hr > 0.5hr) after injection, the intensity from the Mn2+ in WT (yellow) has reached the basal forebrain while the KLC-KO (red) remains primarily at the injection site. B. By 25 hours after injection (25hr > 0.5hr), intensity in the KLC-KO occupies the forebrain also, while in WT the Mn2+ signal is also detected in the contralateral hippocampus (B, white arrow). Only sparse signal is detected in the fornix in this projection of the KLC-KO mice (orange), although signal can be seen in the video. Decreased volume in the fiber tract is likely due to its diminished size (see Figures 8 and 9). All four T-Maps at p < 0.005 (uncorr).
Figure 7
Figure 7. MEMRI detects transport within the fimbria and fornix in the fiber tracts from hippocampus to forebrain
A and C. Statistical map of the effect of condition (time) in an ANOVA across all 30 post-injection images for both genotypes (p<0.05, FDR corr) overlaid onto a gray-scale template image. Signal (red) appears along the fimbria emanating from the hippocampal injection site and not on the contralateral side. A. Axial slice in the MR corresponding to the anatomical position of the hippocampal fimbria (boxed area). Note the red signal from the SPM F-Map highlighting the injection site and emanating from the hippocampus along the fimbria. B, D and E show fluorescence microscopy of histologic sections from mice injected with RDA in similar anatomic locations as the Mn2+, CA3 of the hippocampus. B. Fluorescence microscopy of a coronal histologic section of the corresponding area shows RDA (red fluorescence), the traditional histologic tract-tracer in the hippocampal fimbria. C. In a coronal slice of the same datasets shown in A, statistically significant signal (red) is identified by voxel-wise ANOVA F-map in the fornix (arrow), which correlates anatomically with RDA signal detected by fluorescence microscopy (arrows in D and E), and with the anatomy of CA3 projections.
Figure 8
Figure 8. Anatomy of age-matched KLC-KO and its littermate by diffusion tensor imaging (DTI)
Two of the most aged mice, one from each genotype, were selected for further investigation by DTI. Shown are DT images color-coded for directionality of FA vectors. Eigenvectors were color-coded with red, left-right; green, anterior-posterior; and blue, dorsal-ventral. When the eigenvector is exactly aligned with the coordinate, the color is bright and pure; when at an angle to the coordinate system, the color is mixed proportionally to the directions. 3D stacks of color-coded DTI images from a single WT and its littermate KLC-KO at 13 mo of age are shown, with coronal (A) and axial (B) slices from the WT, and analogous slices from the KLC-KO (C and D respectively). Because of slightly different sizes, the slices do not always pass through the same anatomical structures in the 3D image. Of note is more blended pastel colors in the KLC-KO, suggesting less linearity within the tracts. Also of note is that overall anatomy is not altered significantly in the knock-out compared to its own age-matched littermate. CC: Corpus callosum; AC: Anterior commissure; MSN, medial septal nucleus. Slices are tilted because of the orientation in the 3D dataset. See Supplemental videos S3 and S4 for animation of slices through the two DTI color-coded datasets. Also see Supplemental Figure S1 for size comparison of these two mice, and Figure S2 for higher magnification of the MSN.
Figure 9
Figure 9. Histologic analysis shows decreased size
A and B. Examples of coronal sections through the MSN stained for Thionine/Nissl of WT (A) and KLC-KO (B). Other than decreased size (17±5% decrease in left-right width of coronal sections, p = 0.02), the KLC-KO appears anatomically normal. C and D. A comparison of the corpus callosum shows diminished width (on average 23% smaller in KLC-KO, p = 0.003).

Similar articles

Cited by

References

    1. Aggarwal M, Mori S, Shimogori T, Blackshaw S, Zhang J. Three-dimensional diffusion tensor microimaging for anatomical characterization of the mouse brain. Magn Reson Med. 2010;64:249–261. - PMC - PubMed
    1. Barry J, Gu Y, Jukkola P, O'Neill B, Gu H, Mohler PJ, Rajamani KT, Gu C. Ankyrin-G directly binds to kinesin-1 to transport voltage-gated Na+ channels into axons. Dev Cell. 2014;28:117–131. - PMC - PubMed
    1. Bearer EL, Falzone TL, Zhang X, Biris O, Rasin A, Jacobs RE. Role of neuronal activity and kinesin on tract tracing by manganese-enhanced MRI (MEMRI) Neuroimage. 2007a;37(1):S37–46. - PMC - PubMed
    1. Bearer EL, Zhang X, Jacobs RE. Live imaging of neuronal connections by magnetic resonance: Robust transport in the hippocampal-septal memory circuit in a mouse model of Down syndrome. Neuroimage. 2007b;37:230–242. - PMC - PubMed
    1. Bearer EL, Zhang X, Janvelyan D, Boulat B, Jacobs RE. Reward circuitry is perturbed in the absence of the serotonin transporter. Neuroimage. 2009;46:1091–1104. - PMC - PubMed