

Compression-induced structural and mechanical changes of fibrin-collagen composites
- PMID: 27751946
- PMCID: PMC5392380
- DOI: 10.1016/j.matbio.2016.10.007
Compression-induced structural and mechanical changes of fibrin-collagen composites
Abstract
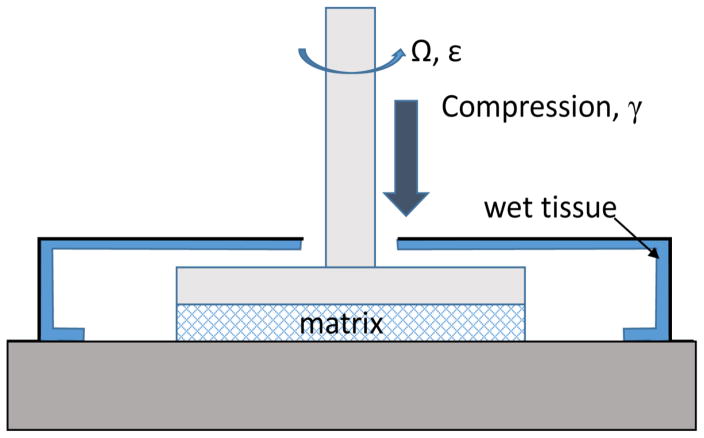
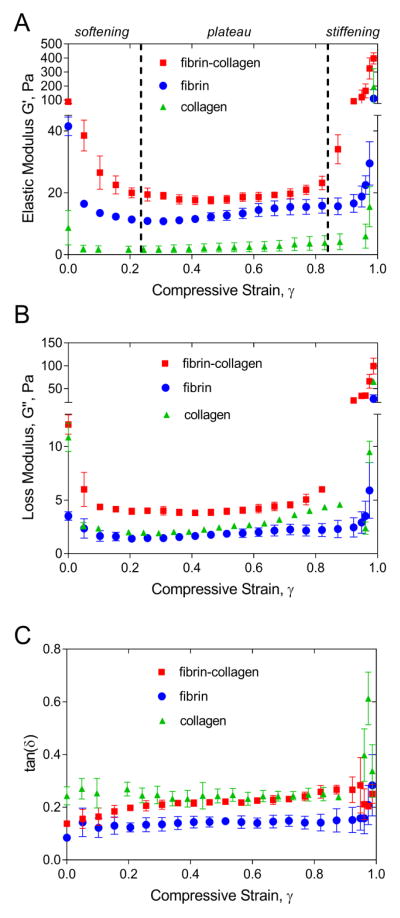
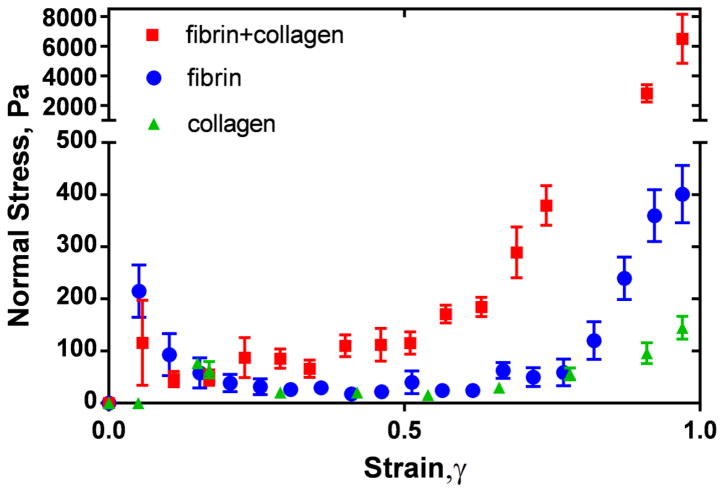
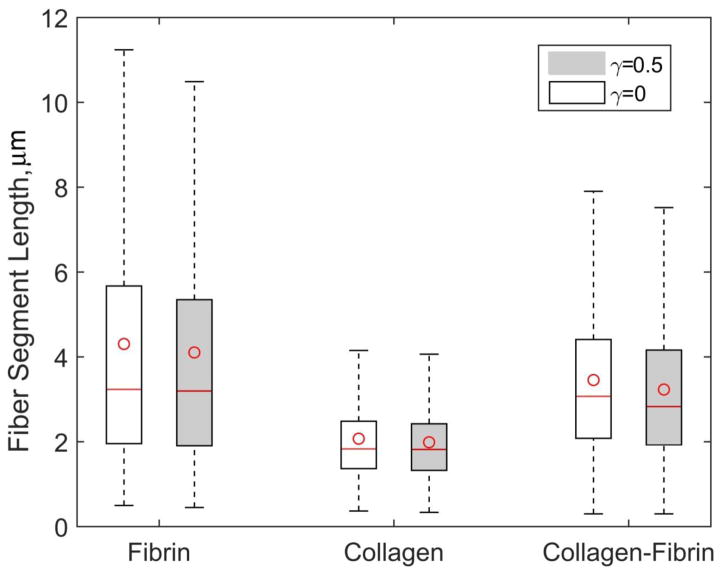
Fibrin and collagen as well as their combinations play an important biological role in tissue regeneration and are widely employed in surgery as fleeces or sealants and in bioengineering as tissue scaffolds. Earlier studies demonstrated that fibrin-collagen composite networks displayed improved tensile mechanical properties compared to the isolated protein matrices. Unlike previous studies, here unconfined compression was applied to a fibrin-collagen filamentous polymer composite matrix to study its structural and mechanical responses to compressive deformation. Combining collagen with fibrin resulted in formation of a composite hydrogel exhibiting synergistic mechanical properties compared to the isolated fibrin and collagen matrices. Specifically, the composite matrix revealed a one order of magnitude increase in the shear storage modulus at compressive strains>0.8 in response to compression compared to the mechanical features of individual components. These material enhancements were attributed to the observed structural alterations, such as network density changes, an increase in connectivity along with criss-crossing, and bundling of fibers. In addition, the compressed composite collagen/fibrin networks revealed a non-linear transformation of their viscoelastic properties with softening and stiffening regimes. These transitions were shown to depend on protein concentrations. Namely, a decrease in protein content drastically affected the mechanical response of the networks to compression by shifting the onset of stiffening to higher degrees of compression. Since both natural and artificially composed extracellular matrices experience compression in various (patho)physiological conditions, our results provide new insights into the structural biomechanics of the polymeric composite matrix that can help to create fibrin-collagen sealants, sponges, and tissue scaffolds with tunable and predictable mechanical properties.
Keywords: Collagen; Compression; Fibrin; Fibrin-collagen composites; Structural properties; Viscoelasticity.
Copyright © 2016 Elsevier B.V. All rights reserved.
Figures


Similar articles
-
Incorporation of fibrin into a collagen-glycosaminoglycan matrix results in a scaffold with improved mechanical properties and enhanced capacity to resist cell-mediated contraction.Acta Biomater. 2015 Oct;26:205-14. doi: 10.1016/j.actbio.2015.08.022. Epub 2015 Aug 20. Acta Biomater. 2015. PMID: 26297884
-
Fibrin gels exhibit improved biological, structural, and mechanical properties compared with collagen gels in cell-based tendon tissue-engineered constructs.Tissue Eng Part A. 2015 Feb;21(3-4):438-50. doi: 10.1089/ten.TEA.2013.0768. Epub 2014 Nov 13. Tissue Eng Part A. 2015. PMID: 25266738 Free PMC article.
-
Microstructure and mechanics of collagen-fibrin matrices polymerized using ancrod snake venom enzyme.J Biomech Eng. 2009 Jun;131(6):061012. doi: 10.1115/1.3128673. J Biomech Eng. 2009. PMID: 19449966 Free PMC article.
-
Fibrin mechanical properties and their structural origins.Matrix Biol. 2017 Jul;60-61:110-123. doi: 10.1016/j.matbio.2016.08.003. Epub 2016 Aug 20. Matrix Biol. 2017. PMID: 27553509 Free PMC article. Review.
-
Biochemical and biophysical aspects of collagen nanostructure in the extracellular matrix.Physiol Res. 2007;56 Suppl 1:S51-S60. doi: 10.33549/physiolres.931302. Epub 2007 May 31. Physiol Res. 2007. PMID: 17552894 Review.
Cited by
-
Tailor-made natural and synthetic grafts for precise urethral reconstruction.J Nanobiotechnology. 2022 Aug 31;20(1):392. doi: 10.1186/s12951-022-01599-z. J Nanobiotechnology. 2022. PMID: 36045428 Free PMC article. Review.
-
A Bioglass-Poly(lactic-co-glycolic Acid) Scaffold@Fibrin Hydrogel Construct to Support Endochondral Bone Formation.Adv Healthc Mater. 2023 Oct;12(25):e2300211. doi: 10.1002/adhm.202300211. Epub 2023 Jul 27. Adv Healthc Mater. 2023. PMID: 37462089 Free PMC article.
-
Bionic artificial skin with a fully implantable wireless tactile sensory system for wound healing and restoring skin tactile function.Nat Commun. 2024 Jan 2;15(1):10. doi: 10.1038/s41467-023-44064-7. Nat Commun. 2024. PMID: 38169465 Free PMC article.
-
Compressive Remodeling Alters Fluid Transport Properties of Collagen Networks - Implications for Tumor Growth.Sci Rep. 2019 Nov 20;9(1):17151. doi: 10.1038/s41598-019-50268-z. Sci Rep. 2019. PMID: 31748563 Free PMC article.
-
Production Technologies and Application of Polymer Composites in Engineering: A Review.Polymers (Basel). 2025 Aug 9;17(16):2187. doi: 10.3390/polym17162187. Polymers (Basel). 2025. PMID: 40871134 Free PMC article. Review.
References
-
- Lee CH, Singla A, Lee Y. Biomedical applications of collagen. Int J Pharm. 2001;221:1–22. - PubMed
-
- Drury JL, Mooney DJ. Hydrogels for tissue engineering: scaffold design variables and applications. Biomaterials. 2003;24:4337–4351. - PubMed
-
- Auger F, Rouabhia M, Goulet F, Berthod F, Moulin V, Germain L. Tissue-engineered human skin substitutes developed from collagen-populated hydrated gels: clinical and fundamental applications. Medical and Biological Engineering and Computing. 1998;36:801–812. - PubMed
-
- Sela J, Kaufman D, Shoshan S, Shani J. Retinoic acid enhances the effect of collagen on bone union, following induced non-union defect in guinea pig ulna. Inflammation Res. 2000;49:679–683. - PubMed
-
- Sato H, Kitazawa H, Adachi I, Horikoshi I. Microdialysis assessment of microfibrous collagen containing a P-glycoprotein-mediated transport inhibitor, cyclosporine A, for local delivery of etoposide. Pharm Res. 1996;13:1565–1569. - PubMed
Publication types
MeSH terms
Substances
Grants and funding
LinkOut - more resources
Full Text Sources
Other Literature Sources
