

Repertoire of mesoscopic cortical activity is not reduced during anesthesia
- PMID: 27751957
- PMCID: PMC5118138
- DOI: 10.1016/j.neuroscience.2016.10.023
Repertoire of mesoscopic cortical activity is not reduced during anesthesia
Abstract
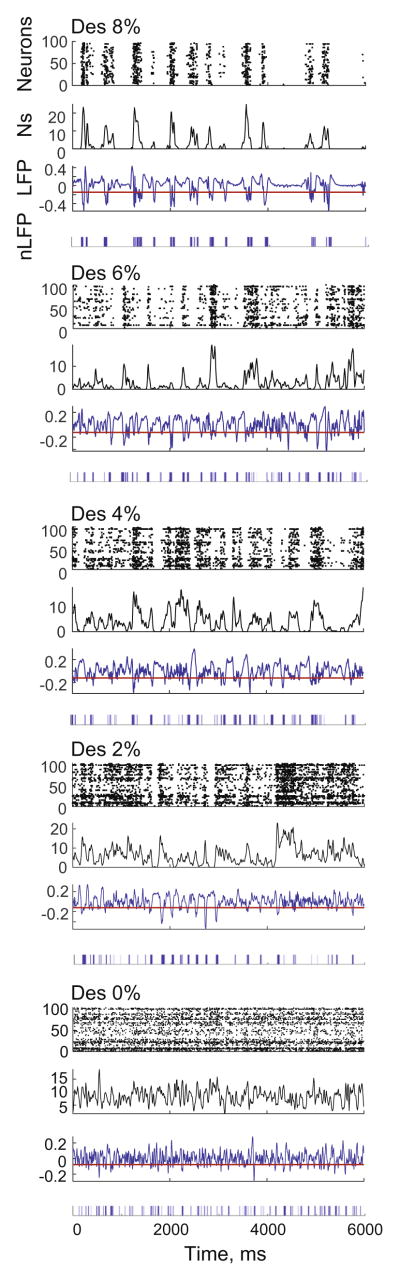
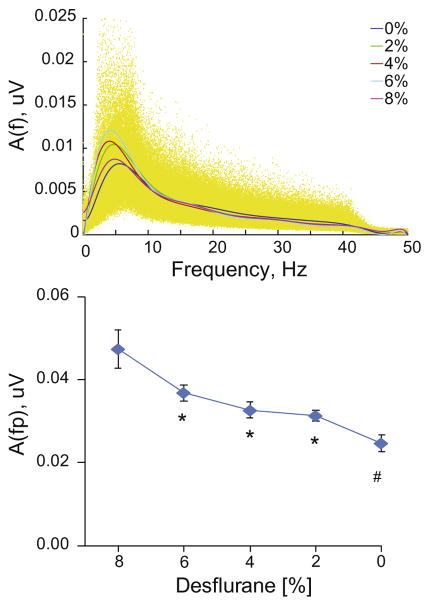
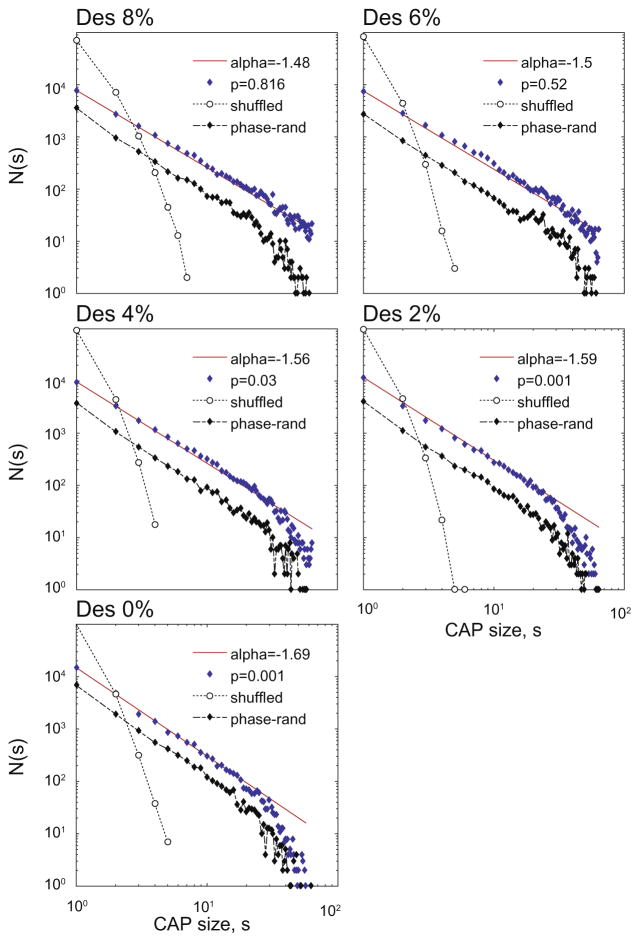
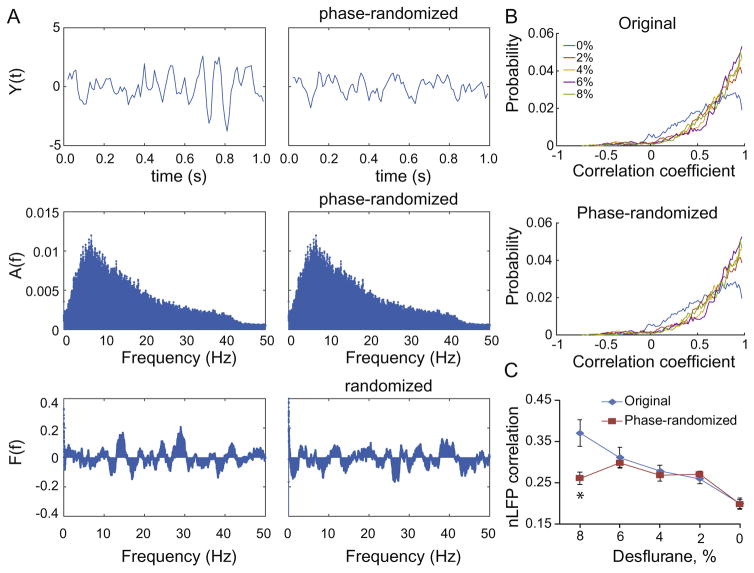
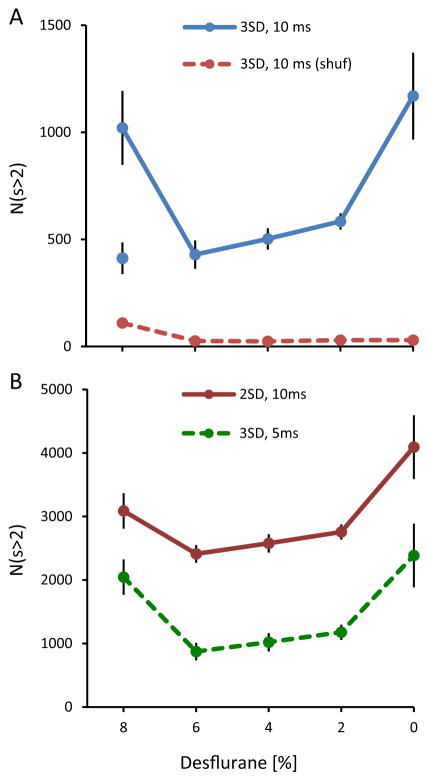
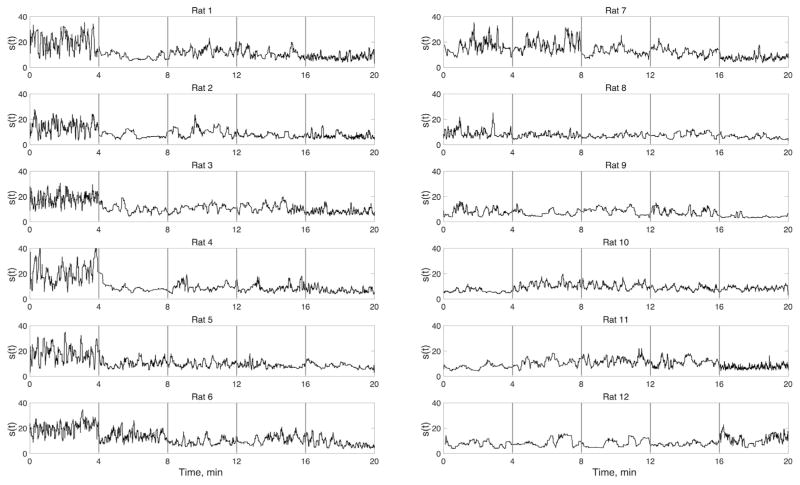
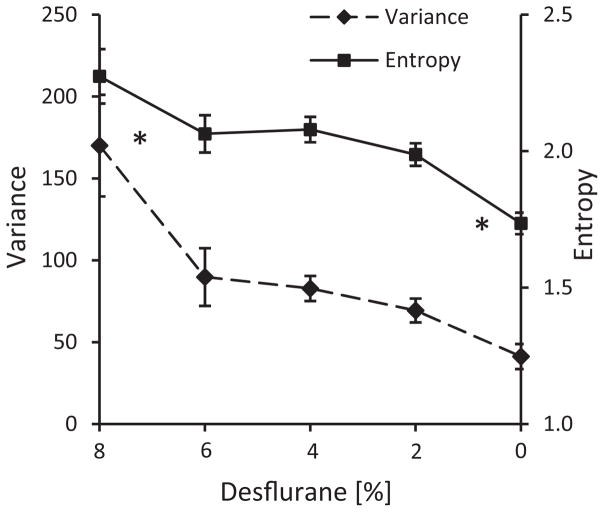
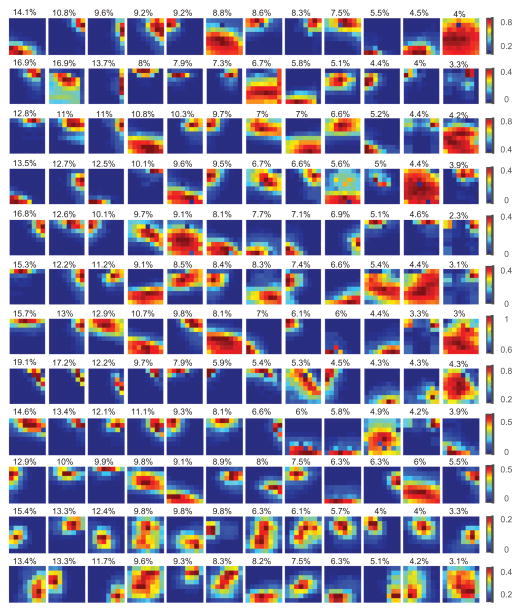
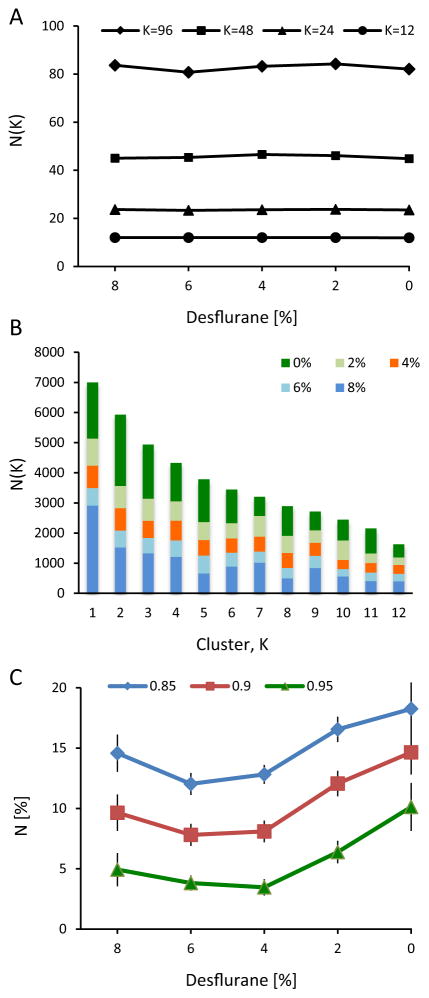
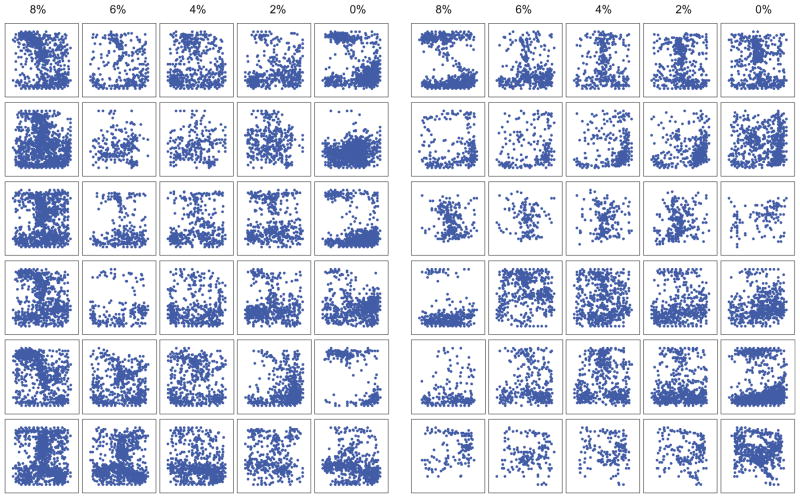
Consciousness has been linked to the repertoire of brain states at various spatiotemporal scales. Anesthesia is thought to modify consciousness by altering information integration in cortical and thalamocortical circuits. At a mesoscopic scale, neuronal populations in the cortex form synchronized ensembles whose characteristics are presumably state-dependent but this has not been rigorously tested. In this study, spontaneous neuronal activity was recorded with 64-contact microelectrode arrays in primary visual cortex of chronically instrumented, unrestrained rats under stepwise decreasing levels of desflurane anesthesia (8%, 6%, 4%, and 2% inhaled concentrations) and wakefulness (0% concentration). Negative phases of the local field potentials formed compact, spatially contiguous activity patterns (CAPs) that were not due to chance. The number of CAPs was 120% higher in wakefulness and deep anesthesia associated with burst-suppression than at intermediate levels of consciousness. The frequency distribution of CAP sizes followed a power-law with slope -1.5 in relatively deep anesthesia (8-6%) but deviated from that at the lighter levels. Temporal variance and entropy of CAP sizes were lowest in wakefulness (76% and 24% lower at 0% than at 8% desflurane, respectively) but changed little during recovery of consciousness. CAPs categorized by K-means clustering were conserved at all anesthesia levels and wakefulness, although their proportion changed in a state-dependent manner. These observations yield new knowledge about the dynamic landscape of ongoing population activity in sensory cortex at graded levels of anesthesia. The repertoire of population activity and self-organized criticality at the mesoscopic scale do not appear to contribute to anesthetic suppression of consciousness, which may instead depend on large-scale effects, more subtle dynamic properties, or changes outside of primary sensory cortex.
Keywords: anesthesia; avalanche; consciousness; criticality; information integration; synchrony.
Copyright © 2016 IBRO. Published by Elsevier Ltd. All rights reserved.
Figures
Similar articles
-
Graded defragmentation of cortical neuronal firing during recovery of consciousness in rats.Neuroscience. 2014 Sep 5;275:340-51. doi: 10.1016/j.neuroscience.2014.06.018. Epub 2014 Jun 18. Neuroscience. 2014. PMID: 24952333 Free PMC article.
-
Critical Changes in Cortical Neuronal Interactions in Anesthetized and Awake Rats.Anesthesiology. 2015 Jul;123(1):171-80. doi: 10.1097/ALN.0000000000000690. Anesthesiology. 2015. PMID: 25955982 Free PMC article.
-
State-Dependent Cortical Unit Activity Reflects Dynamic Brain State Transitions in Anesthesia.J Neurosci. 2020 Dec 2;40(49):9440-9454. doi: 10.1523/JNEUROSCI.0601-20.2020. Epub 2020 Oct 29. J Neurosci. 2020. PMID: 33122389 Free PMC article.
-
Neurochemical modulators of sleep and anesthetic states.Int Anesthesiol Clin. 2008 Summer;46(3):75-104. doi: 10.1097/AIA.0b013e318181a8ca. Int Anesthesiol Clin. 2008. PMID: 18617819 Free PMC article. Review. No abstract available.
-
Anesthesia and the neurobiology of consciousness.Neuron. 2024 May 15;112(10):1553-1567. doi: 10.1016/j.neuron.2024.03.002. Epub 2024 Apr 4. Neuron. 2024. PMID: 38579714 Free PMC article. Review.
Cited by
-
Reduced Repertoire of Cortical Microstates and Neuronal Ensembles in Medically Induced Loss of Consciousness.Cell Syst. 2019 May 22;8(5):467-474.e4. doi: 10.1016/j.cels.2019.03.007. Epub 2019 May 1. Cell Syst. 2019. PMID: 31054810 Free PMC article.
-
Neural Correlates of Unconsciousness in Large-Scale Brain Networks.Trends Neurosci. 2018 Mar;41(3):150-160. doi: 10.1016/j.tins.2018.01.003. Epub 2018 Feb 3. Trends Neurosci. 2018. PMID: 29409683 Free PMC article. Review.
-
Dynamic Reconfiguration, Fragmentation, and Integration of Whole-Brain Modular Structure across Depths of Unconsciousness.Cereb Cortex. 2020 Sep 3;30(10):5229-5241. doi: 10.1093/cercor/bhaa085. Cereb Cortex. 2020. PMID: 32469053 Free PMC article.
-
A scoping review for building a criticality-based conceptual framework of altered states of consciousness.Front Syst Neurosci. 2023 May 25;17:1085902. doi: 10.3389/fnsys.2023.1085902. eCollection 2023. Front Syst Neurosci. 2023. PMID: 37304151 Free PMC article.
-
Cortical recurrence supports resilience to sensory variance in the primary visual cortex.Commun Biol. 2023 Jun 23;6(1):667. doi: 10.1038/s42003-023-05042-3. Commun Biol. 2023. PMID: 37353519 Free PMC article.
References
-
- Angel A. The G. L. Brown lecture. Adventures in anaesthesia. Exp Physiol. 1991;76:1–38. - PubMed
-
- Armstrong-James M, George MJ. Influence of anesthesia on spontaneous activity and receptive field size of single units in rat Sm1 neocortex. Exp Neurol. 1988;99:369–387. - PubMed
-
- Bachmann T. Is conscious experience established instantaneously? Commentary on J.G. Taylor. Conscious Cogn. 1998;7:149–156. - PubMed
MeSH terms
Substances
Grants and funding
LinkOut - more resources
Full Text Sources
Other Literature Sources
Molecular Biology Databases
Miscellaneous
