

Population Analysis of Adverse Events in Different Age Groups Using Big Clinical Trials Data
- PMID: 27751983
- PMCID: PMC5088342
- DOI: 10.2196/medinform.6437
Population Analysis of Adverse Events in Different Age Groups Using Big Clinical Trials Data
Abstract
Background: Understanding adverse event patterns in clinical studies across populations is important for patient safety and protection in clinical trials as well as for developing appropriate drug therapies, procedures, and treatment plans.
Objectives: The objective of our study was to conduct a data-driven population-based analysis to estimate the incidence, diversity, and association patterns of adverse events by age of the clinical trials patients and participants.
Methods: Two aspects of adverse event patterns were measured: (1) the adverse event incidence rate in each of the patient age groups and (2) the diversity of adverse events defined as distinct types of adverse events categorized by organ system. Statistical analysis was done on the summarized clinical trial data. The incident rate and diversity level in each of the age groups were compared with the lowest group (reference group) using t tests. Cohort data was obtained from ClinicalTrials.gov, and 186,339 clinical studies were analyzed; data were extracted from the 17,853 clinical trials that reported clinical outcomes. The total number of clinical trial participants was 6,808,619, and total number of participants affected by adverse events in these trials was 1,840,432. The trial participants were divided into eight different age groups to support cross-age group comparison.
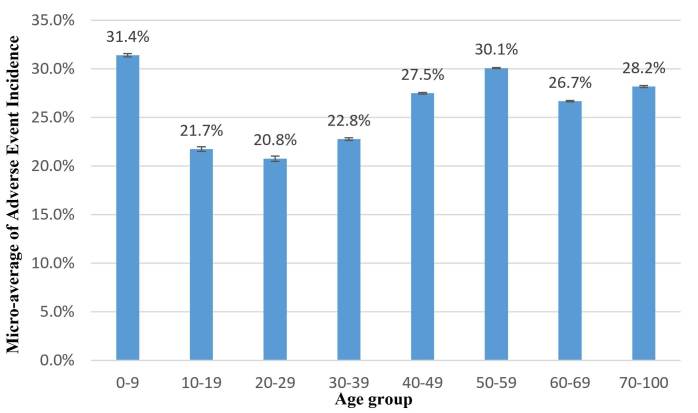
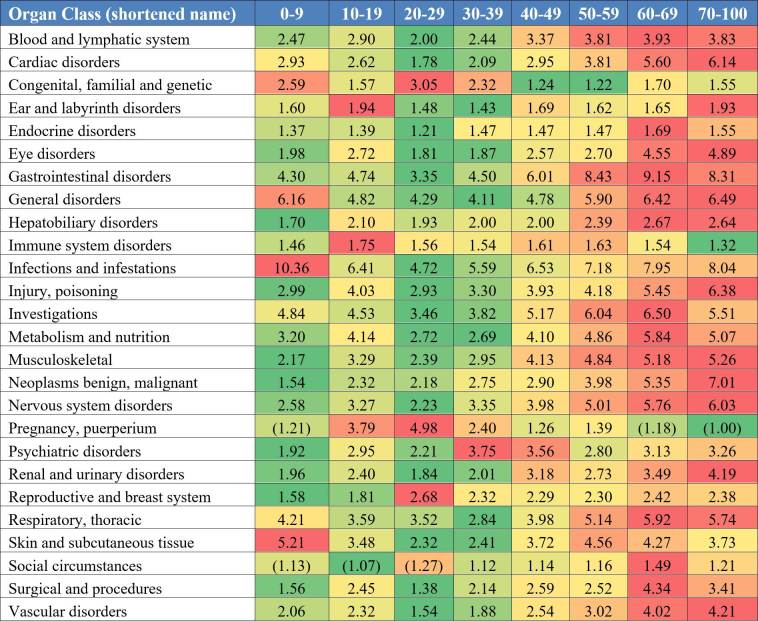
Results: In general, children and older patients are more susceptible to adverse events in clinical trial studies. Using the lowest incidence age group as the reference group (20-29 years), the incidence rate of the 0-9 years-old group was 31.41%, approximately 1.51 times higher (P=.04) than the young adult group (20-29 years) at 20.76%. The second-highest group is the 50-59 years-old group with an incidence rate of 30.09%, significantly higher (P<.001) when compared with the lowest incidence in the 20-29 years-old group. The adverse event diversity also increased with increase in patient age. Clinical studies that recruited older patients (older than 40 years) were more likely to observe a diverse range of adverse events (P<.001). Adverse event diversity increased at an average rate of 77% for each age group (older than 30 years) until reaching the 60-69 years-old group, which had a diversity level of 54.7 different types of adverse events per trial arm. The 70-100 years-old group showed the highest diversity level of 55.5 events per trial arm, which is approximately 3.44 times more than the 20-29 years-old group (P<.001). We also observe that adverse events display strong age-related patterns among different categories.
Conclusion: The results show that there is a significant adverse event variance at the population level between different age groups in clinical trials. The data suggest that age-associated adverse events should be considered in planning, monitoring, and regulating clinical trials.
Keywords: adverse events; big data analysis; clinical trial data; clinical trial safety; data processing and integration; population health.
Conflict of interest statement
Conflicts of Interest: None declared.
Figures


Similar articles
-
The causes and effects of socio-demographic exclusions from clinical trials.Health Technol Assess. 2005 Oct;9(38):iii-iv, ix-x, 1-152. doi: 10.3310/hta9380. Health Technol Assess. 2005. PMID: 16181564 Review.
-
Italian cancer figures, report 2012: Cancer in children and adolescents.Epidemiol Prev. 2013 Jan-Feb;37(1 Suppl 1):1-225. Epidemiol Prev. 2013. PMID: 23585445 English, Italian.
-
Interventions for treating femoral shaft fractures in children and adolescents.Evid Based Child Health. 2014 Dec;9(4):753-826. doi: 10.1002/ebch.1987. Evid Based Child Health. 2014. PMID: 25504970
-
Association between pacifier use and breast-feeding, sudden infant death syndrome, infection and dental malocclusion.JBI Libr Syst Rev. 2005;3(6):1-33. doi: 10.11124/01938924-200503060-00001. JBI Libr Syst Rev. 2005. PMID: 27819973
-
Cardiovascular adverse events in oncology trials: understanding and appreciating the differences between clinical trial data and real-world reports.Cardiooncology. 2022 Jul 19;8(1):13. doi: 10.1186/s40959-022-00139-w. Cardiooncology. 2022. PMID: 35854393 Free PMC article. Review.
Cited by
-
Evaluating the Real-World Use of Topical Diclofenac Sodium Gel 1% Using US Longitudinal Electronic Health Records Database: A study supporting OTC switch.Pain Ther. 2025 Jun;14(3):1007-1024. doi: 10.1007/s40122-025-00723-9. Epub 2025 Apr 2. Pain Ther. 2025. PMID: 40172751 Free PMC article.
-
Assessing the quality of evidence on safety: specifications for application and suggestions for adaptions of the GRADE-criteria in the context of preparing a list of potentially inappropriate medications for older adults.BMC Med Res Methodol. 2022 Aug 30;22(1):234. doi: 10.1186/s12874-022-01715-5. BMC Med Res Methodol. 2022. PMID: 36042413 Free PMC article.
-
Out-of-hours emergent surgery for degenerative spinal disease in Canada: a retrospective cohort study from a national registry.Lancet Reg Health Am. 2024 Jun 11;36:100816. doi: 10.1016/j.lana.2024.100816. eCollection 2024 Aug. Lancet Reg Health Am. 2024. PMID: 38966387 Free PMC article.
-
Video Versus Face-To-Face Preoperative Anaesthetic Assessment: The VIDFACE Trial-A Statistical Analysis Plan.Acta Anaesthesiol Scand. 2025 Jul;69(6):e70068. doi: 10.1111/aas.70068. Acta Anaesthesiol Scand. 2025. PMID: 40467292 Free PMC article. Clinical Trial.
-
The effect of age and resilience on the dose-response function between the number of adversity factors and subjective well-being.Front Psychol. 2024 Feb 9;15:1332124. doi: 10.3389/fpsyg.2024.1332124. eCollection 2024. Front Psychol. 2024. PMID: 38406308 Free PMC article.
References
-
- ClinicalTrials.gov. 2016. [2016-10-02]. https://clinicaltrials.gov/
-
- Lazarou J, Pomeranz B, Corey PN. Incidence of adverse drug reactions in hospitalized patients: a meta-analysis of prospective studies. JAMA. 1998 Apr 15;279(15):1200–5.jma71005 - PubMed
-
- Kaushal R, Bates D, Landrigan C, McKenna K, Clapp M, Federico F, Goldmann DA. Medication errors and adverse drug events in pediatric inpatients. JAMA. 2001 Apr 25;285(16):2114–2120.joc01942 - PubMed
-
- Moore T, Weiss S, Kaplan S, Blaisdell CJ. Reported adverse drug events in infants and children under 2 years of age. Pediatrics. 2002 Nov;110(5):e53. - PubMed
-
- Rich M, McSherry F, Williford W, Yusuf S, Digitalis Investigation Group Effect of age on mortality, hospitalizations and response to digoxin in patients with heart failure: the DIG study. J Am Coll Cardiol. 2001 Sep;38(3):806–813. http://linkinghub.elsevier.com/retrieve/pii/S0735-1097(01)01442-5 S0735-1097(01)01442-5 - PubMed
LinkOut - more resources
Full Text Sources
Other Literature Sources
