. 2016 Oct 18:6:34976.
doi: 10.1038/srep34976.

Catechin tuned magnetism of Gd-doped orthovanadate through morphology as T1-T2 MRI contrast agents

Affiliations

Catechin tuned magnetism of Gd-doped orthovanadate through morphology as T1-T2 MRI contrast agents

Tamilmani Vairapperumal et al. Sci Rep. .

Abstract

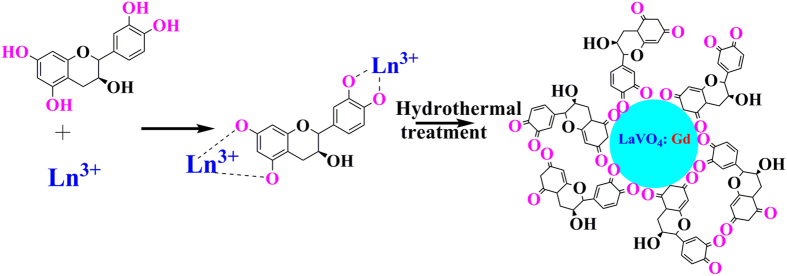
Tetragonal (t)-LaVO4 has turned out to be a potential host for luminescent materials. Synthesis of t-LaVO4 till date has been based on chelating effect of EDTA making it not ideal for bioimaging applications. An alternative was proposed by us through the use of catechin. In recent times there is interest for new MRI contrast agents that can through appropriate doping function both as MRI contrast and optical/upconversion materials. It is generally believed that under appropriate doping, t-LaVO4 would be a better upconversion material than monoclinic (m)-LaVO4. Based on these postulations, this work explores the use of gadolinium doped t-LaVO4 as an MRI contrast agent. From literature, gadolinium oxide is a good T1 contrast agent. Through this work, using catechin as a template for the synthesis of Gd doped t-LaVO4, we demonstrate the possible use as a T1 contrast agent. Interestingly, as the catechin concentration changes, morphology changes from nanorods to square nanoplates and spheres. In this process, a switch from T1 to T2 contrast agent was also observed. Under optimal concentration of catechin, with a rod shaped Gd doped t-LaVO4 an r2/r1 value of 21.30 was observed. Similarly, with a spherical shape had an r2/r1 value of 1.48 was observed.


Figures

Figure 1
Figure 1
XRD pattern of GL nanoparticles (A) without cat (a) and cat (b, [cat4+]/[La3+] = 1:0.05) (Experimental conditions: T = 210 °C, t = 4 h, pH = 7), (B) [cat4+]/[La3+] = 1:0.01(c), [cat4+]/[La3+] = 1:0.05(d) and [cat4+]/[La3+] = 1:1 (e) (Experimental conditions: T = 180 °C, t = 24 h) and (C) Corresponding W-H plot.
Figure 2
Figure 2. Depicts the formation of GL nanoparticles using catechin hydrate.
Figure 3
Figure 3. Final Rietveld XRD data plot of GL nanoparticles with the values of agreement factors and χ2 (red, observed; green, calculated; black, vertical bars – positions of the Bragg reflections; pink, difference between observed and calculated intensities).
Figure 4
Figure 4
TEM Image for MGL (a), TGL (b), 01GL (c), 5GL (e) and 1GL (g) and HRTEM images of 01GL (d), 5GL (f) and 1GL (h) nanoparticles [Inset represents the corresponding SAED pattern].
Figure 5
Figure 5
FTIR spectrum (A) and TGA (B) for (a) MGL, (b) TGL, (c) 01GL, (d) 5GL and (e) 1GL nanoparticles.
Figure 6
Figure 6
DLS (1) and Zeta potential (2) for (a) MGL, (b) TGL, (c) 01GL, (d) 5GL, and (e) 1GL nanoparticles.
Figure 7
Figure 7
Zeta potential at various pH values for (A) 01GL (a), 5GL (b) and 1GL (c) and EDAX spectrum (B) nanoparticles.
Figure 8
Figure 8
Absorption (Black line) and luminescence spectra (Blue line) for Gd doped t-LaVO4 nanoparticles.
Figure 9
Figure 9
Magnetization curves of GL nanoparticles at 300 K 1) without cat (a) and cat (b, [cat4−]/[La3 +] = 1:0.05) (Experimental conditions: T = 210 °C, t = 4 h, pH = 7), 2) [cat4−]/[La3+] = 1:0.01 (c), [cat4−]/[La3+] = 1:0.05 (d) and [cat4−]/[La3+] = 1:1 (e) (Experimental conditions: T = 180 °C, t = 24 h).
Figure 10
Figure 10
Linear fit plot employed for the calculation of r1 and r2: T1- and T2-weighted phantom images of GL nanoparticles with different concentrations where (a) MGL and (b) TGL. Subscript 1 and 2 represents T1 and T2 relaxivity.
Figure 11
Figure 11
Linear fit plot employed for the calculation of r1 and r2: T1- and T2-weighted phantom images of GL nanoparticles with different concentrations where (a) 01GL, (b) 5GL and (c) 1GL. Subscript 1 and 2 represents T1 and T2 relaxivity.

References

    1. Nunez N. O. et al.. Surface modified Eu:GdVO4 nanocrystals for optical and MRI imaging. Dalton Transactions 42, 10725–10734, 10.1039/C3DT50676B (2013). - DOI - PubMed
    1. Wang H. & Wang L. One-Pot Syntheses and Cell Imaging Applications of Poly(amino acid) Coated LaVO4:Eu3+ Luminescent Nanocrystals. Inorganic Chemistry 52, 2439–2445, 10.1021/ic302297u (2013). - DOI - PubMed
    1. Wang F., Peng E., Zheng B., Li S. F. Y. & Xue J. M. Synthesis of Water-Dispersible Gd2O3/GO Nanocomposites with Enhanced MRI T1 Relaxivity. The Journal of Physical Chemistry C 119, 23735–23742, 10.1021/acs.jpcc.5b06037 (2015). - DOI
    1. Abdesselem M. et al.. Multifunctional Rare-Earth Vanadate Nanoparticles: Luminescent Labels, Oxidant Sensors, and MRI Contrast Agents. ACS Nano 8, 11126–11137, 10.1021/nn504170x (2014). - DOI - PubMed
    1. Yang D. et al.. Current advances in lanthanide ion (Ln3+)-based upconversion nanomaterials for drug delivery. Chemical Society Reviews 44, 1416–1448, 10.1039/C4CS00155A (2015). - DOI - PubMed

Publication types

LinkOut - more resources