. 2016 Oct 18:6:35376.
doi: 10.1038/srep35376.

Massive release of extracellular vesicles from cancer cells after photodynamic treatment or chemotherapy

Affiliations

Massive release of extracellular vesicles from cancer cells after photodynamic treatment or chemotherapy

Kelly Aubertin et al. Sci Rep. .

Abstract

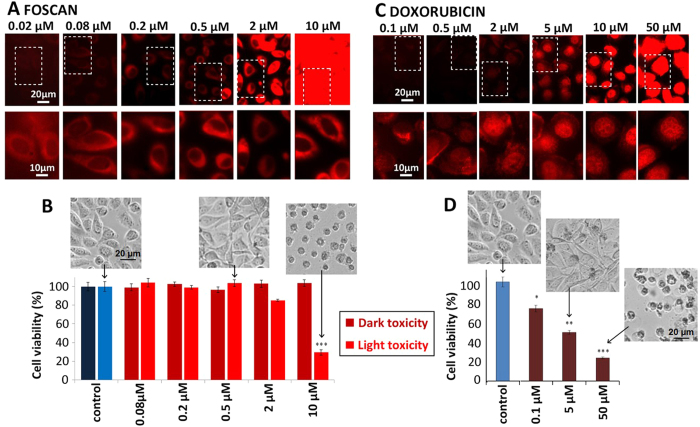
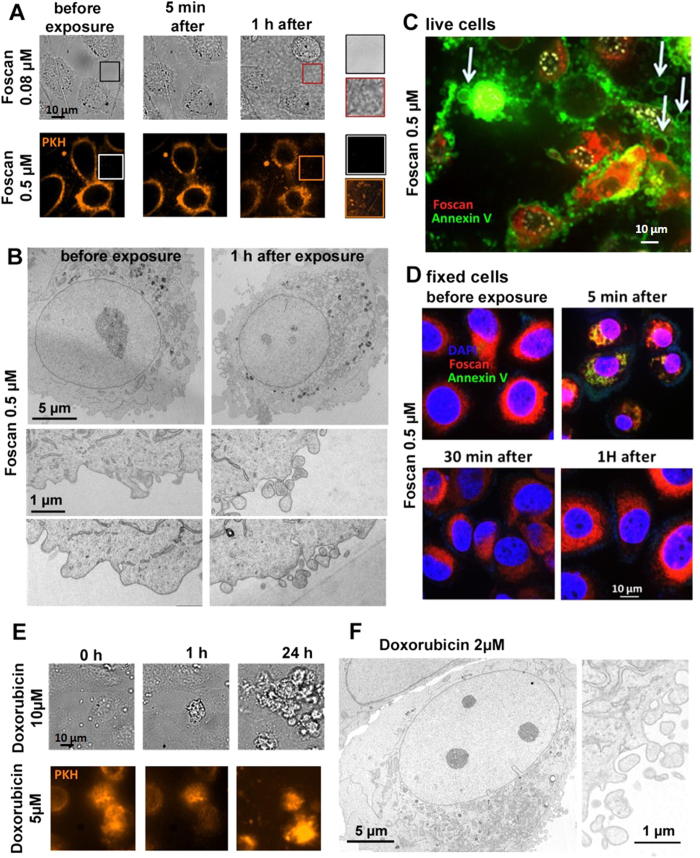
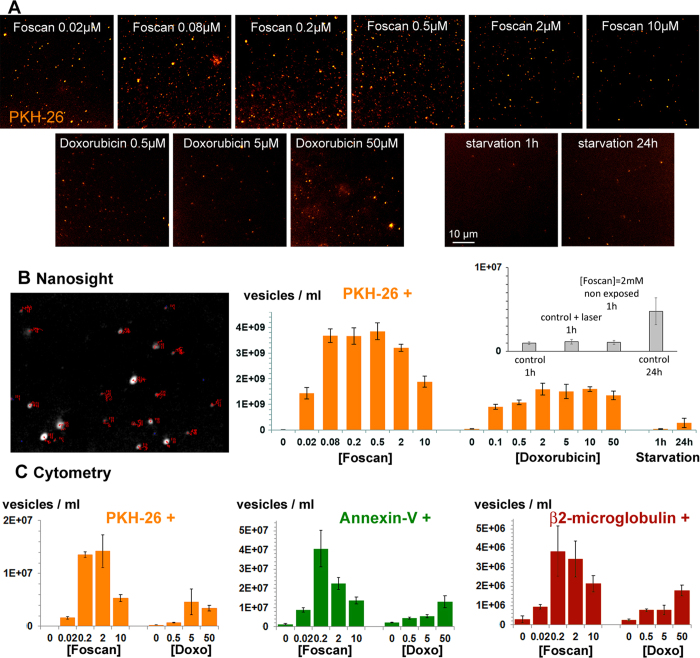
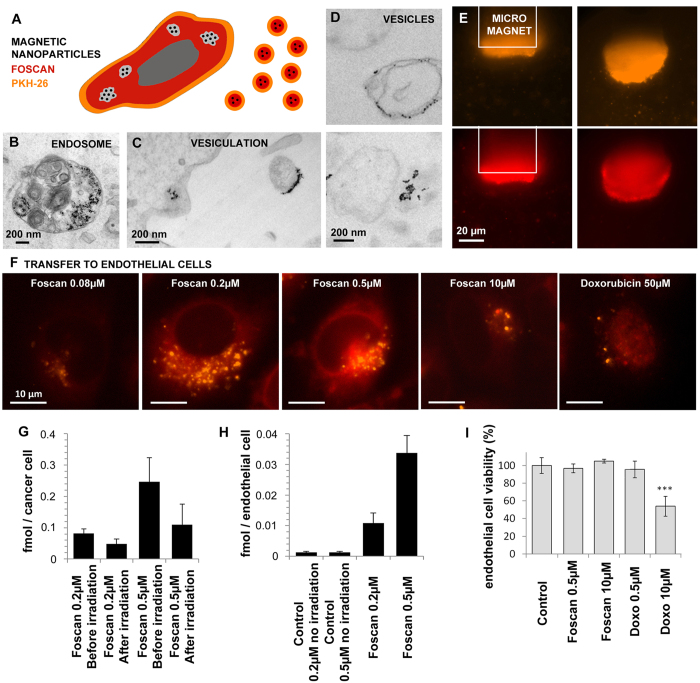
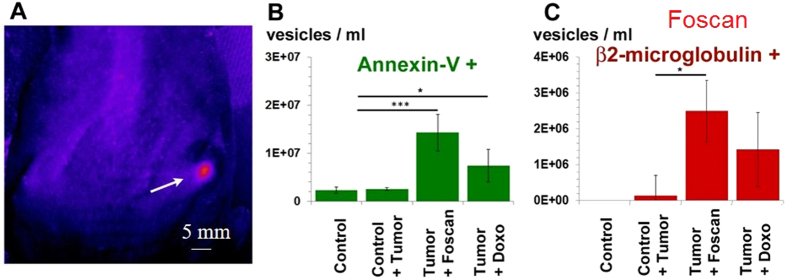
Photodynamic therapy is an emerging cancer treatment that is particularly adapted for localized malignant tumor. The phototherapeutic agent is generally injected in the bloodstream and circulates in the whole organism as a chemotherapeutic agent, but needs light triggering to induce localized therapeutic effects. We found that one of the responses of in vitro and in vivo cancer cells to photodynamic therapy was a massive production and emission of extracellular vesicles (EVs): only 1 hour after the photo-activation, thousands of vesicles per cell were emitted in the extracellular medium. A similar effect has been found after treatment with Doxorubicin (chemotherapy), but far less EVs were produced, even 24 hours after the treatment. Furthermore, we found that the released EVs could transfer extracellular membrane components, drugs and even large intracellular objects to naive target cells. In vivo, photodynamic treatment and chemotherapy increased the levels of circulating EVs several fold, confirming the vast induction of cancer cell vesiculation triggered by anti-cancer therapies.


Figures

Figure 1
Figure 1. Cancer cell treatment with the Foscan® photosensitizer or Doxorubicin.
(A) Fluorescence microscopy of CCs 24 hours after 2-hour incubation with Foscan® from 0.02 to 10 μM. Concentration-dependent drug uptake was shown by the enhancement of direct fluorescence emission as the concentration increased. All images were acquired with the same acquisition time (20 ms). The same scaling was applied to the whole images, while images shown in the inset were autoscaled. Diffuse cytoplasmic distribution was observed in all conditions. (B) Cell viability was assessed by measuring metabolic activity, either in the absence of light exposure (dark toxicity) or 24 hours following light exposure (light toxicity). No metabolic activity changes were observed except for 2 and 10 μM concentrations. (C) Fluorescence microscopy of CCs 24 hours following 2-hour incubation with DOX from 0.1 to 50 μM. Concentration-dependent drug uptake was shown by direct fluorescence emission (top panel with the same scaling, for the same exposure time of 200 ms). A higher magnification is provided in the autoscaled bottom panel, where DOX was mainly contained in the nucleus. (D) Cell viability was assessed by measuring metabolic activity 24 h after DOX incubation, and ranged from 70% to 20% at 0.1 μM and 50 μM, respectively.
Figure 2
Figure 2. Vesicle release from CCs following PDT or DOX.
(A) Optical microscopy of living cells before and after Foscan® PDT (0.08 μM in bright field images and 0.5 μM in the fluorescence images, with PKH orange staining of the cell membranes). Vesiculation was observed in the culture medium, which became cloudy/milky, as observed in bright field images. Under orange fluorescence, bright and highly mobile spots appeared outside the cells (see movie S1). (B) Transmission electron micrographs of cells loaded with Foscan® (0.5 μM), before (left) or 1 hour after (right) light exposure. Intense extracellular vesicle shedding occurred 1 hour after PDT. (C) Fluorescence imaging of living Foscan®-loaded (0.5 μM) CCs 5 min after light exposure. Cell membrane is annexin positive for most of the cells, indicating apoptosis. Apoptosis is further evidenced by the shedding of vesicles. Annexin-positive EVs are indicated by white arrows. (D) Analysis of CC apoptosis by fluorescence microscopy of annexin-A5 staining in fixed cells, before exposure, 5 min, 30 min and 1 hour after PDT (Foscan® 0.5 μM), as compared to a control without light exposure. Red fluorescence is emitted by Foscan®, and the apoptosis marker annexin-A5-FITC appears in green. Transient annexin-A5 staining was observed only 5 min after exposure. The apoptosis marker was no longer detected 30 min or 1 hour later, indicating a reversible effect. (E) Bright-field and fluorescence (orange membrane staining) images before and after DOX treatment (10 and 5 μM, respectively). Vesicles were observed in the extracellular medium, but only after 24 hours (see orange spots in the 5 μM condition), and they were less abundant than after PDT. (F) Transmission electron micrographs of CCs 24 hours after DOX exposure (2 μM). At 2 μM, the cells shed EVs, but still fewer than after PDT.
Figure 3
Figure 3. Vesicle quantification by NTA and FACS.
(A) Fluorescence microscopy of conditioned medium after PDT, DOX treatment or starvation of PKH-stained CCs. A large number of fluorescent submicronic events were observed, particularly at the intermediate Foscan® concentration. (B) Quantification of EV release (per million cells) by NTA in all conditions. Quantification was based on the detection of a PKH-26-stained population. Vesicle release was more abundant at intermediate Foscan® concentrations, creating a bell-shaped curve, while it increased slightly as the DOX concentration rose. Note that 0 mM corresponds to 1-hour starvation (left) or 24-hour starvation (right). The inset corresponds to unlabelled/unexposed; labeled/unexposed or unlabeled/exposed controls (C) Quantification of EV release (EV/ml) by FACS. Quantification was based on the detection of populations positive for PKH-26, annexin-A5 or human β2-microglobulin. The concentration-response profile was in keeping with the results of NTA, for all the fluorescence markers.
Figure 4
Figure 4. Vesicle contents and their transfer to naïve endothelial cells.
(A) Schematic representation of treatment-induced release of vesicles carrying magnetic nanoprobes (black spots), PKH dye (orange) and Foscan® (red). (B) Magnetic nanoprobes, visualized as electron-dense spots, were initially located in the endosomal compartment of CCs. (C,D) 1 hour after PDT (light exposure), the magnetic nanoprobes were contained in the released vesicles. (E) Vesicles released by CCs loaded with magnetic nanoprobes were further tested for their magnetism: they were attracted with a 50-μm-diameter cylindrical micromagnet while simultaneously emitting red and orange fluorescence, reflecting co-encapsulation of the magnetic probes and PKH (top) or Foscan® (bottom). (F) Fluorescence micrographs of naïve ECs following incubation with conditioned medium from CCs exposed to DOX or PDT. Endothelial recipient cells displayed characteristic PKH and Foscan® or DOX fluorescence emission, indicating their uptake of vesicles containing the drug. (G) The Foscan® intracellular concentration in CCs decreased after light exposure, suggesting a partial loss of their Foscan® content via vesiculation. (H) Foscan® was detected in recipient ECs (right). Concentration-dependent transfer was observed: recipient ECs contained a larger drug load when incubated with conditioned medium from CCs treated with Foscan® at 0.5 μM than at 0.2 μM. Foscan® was scarcely detected in recipient ECs incubated with conditioned medium from Foscan®-treated but non-irradiated cells. (I) Recipient ECs showed no reduction in viability after incubation with conditioned medium from CCs (no dark toxicity). Conversely, a cytotoxic effect was observed during incubation in conditioned medium from cells treated with DOX, which does not require a physical trigger to exert its effects.
Figure 5
Figure 5. PDT and DOX induction of vesicle release in vivo (mice with subcutaneous PC3 tumors).
(A) Fluorescence imaging of a Foscan®-injected mouse, showing the presence of the drug at the tumor site. (B) FACS of plasma from mice treated with DOX or PDT showed more annexin-A5-positive vesicles than in healthy controls and untreated tumor-bearing mice. (C) Vesicles released after DOX or PDT were human β2-microglobulin-positive, indicating that they originated from the human CCs.

Similar articles

Cited by

References

    1. Balkwill F., Charles K. A. & Mantovani A. Smoldering and polarized inflammation in the initiation and promotion of malignant disease. Cancer Cell 7, 211–217 (2005). - PubMed
    1. Lin W.-W. & Karin M. A cytokine-mediated link between innate immunity, inflammation, and cancer. J Clin Invest 117, 1175–1183 (2007). - PMC - PubMed
    1. Parmiani G. & Maccalli C. The early antitumor immune response is necessary for tumor growth: Re-visiting Prehn’s hypothesis in the human melanoma system. Oncoimmunology 1, 930–934 (2012). - PMC - PubMed
    1. Rivoltini L. et al.. Escape strategies and reasons for failure in the interaction between tumour cells and the immune system: how can we tilt the balance towards immune-mediated cancer control? Expert Opin Biol Ther 5, 463–476 (2005). - PubMed
    1. Zou W. Immunosuppressive networks in the tumour environment and their therapeutic relevance. Nat Rev Cancer 5, 263–274 (2005). - PubMed

Publication types