

LPS-TLR4 Pathway Mediates Ductular Cell Expansion in Alcoholic Hepatitis
- PMID: 27752144
- PMCID: PMC5067590
- DOI: 10.1038/srep35610
LPS-TLR4 Pathway Mediates Ductular Cell Expansion in Alcoholic Hepatitis
Abstract
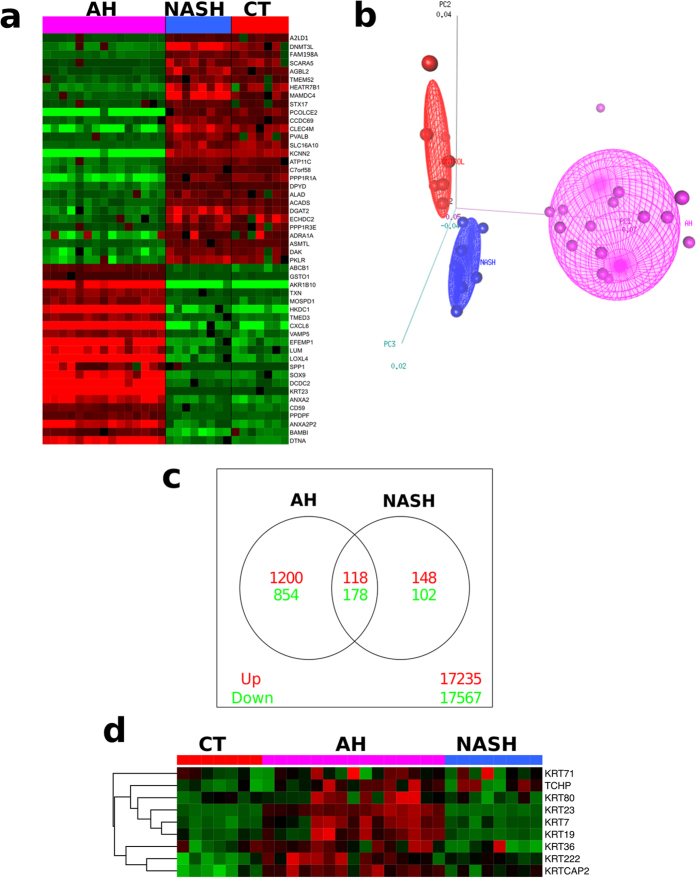
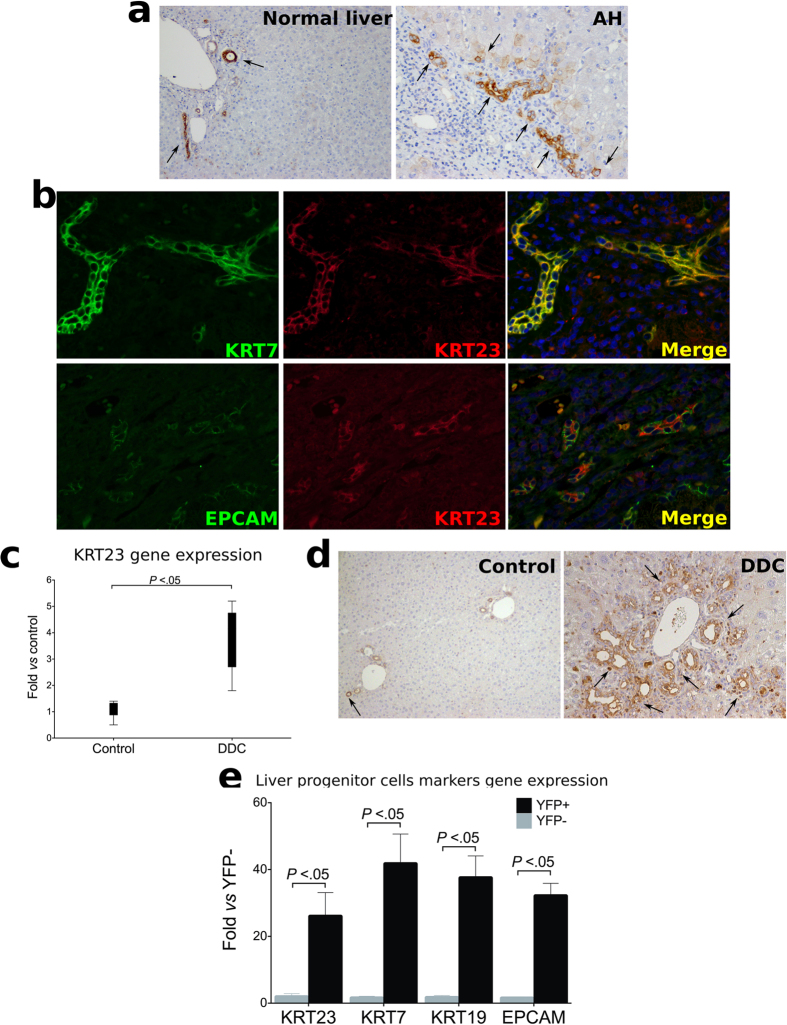
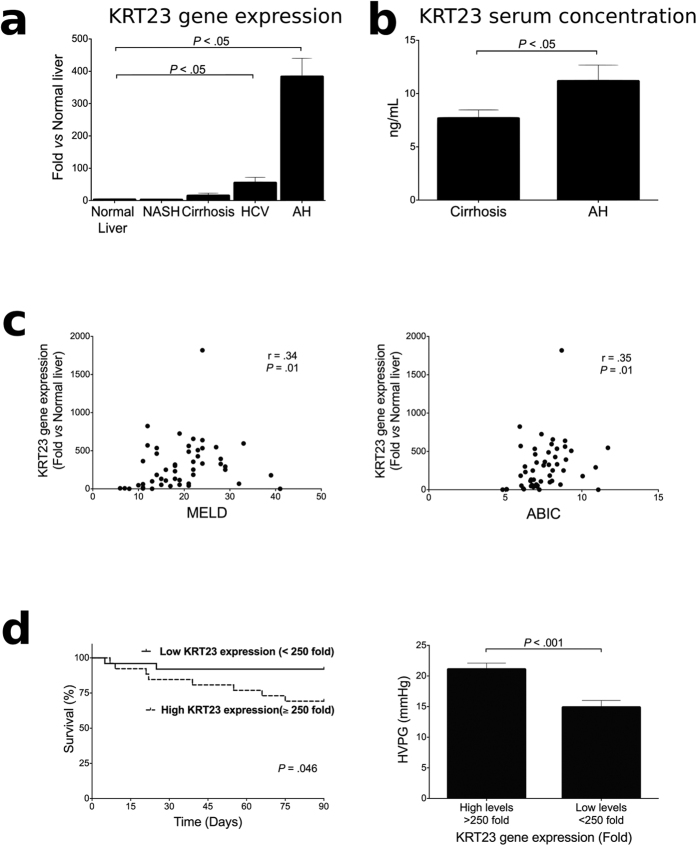
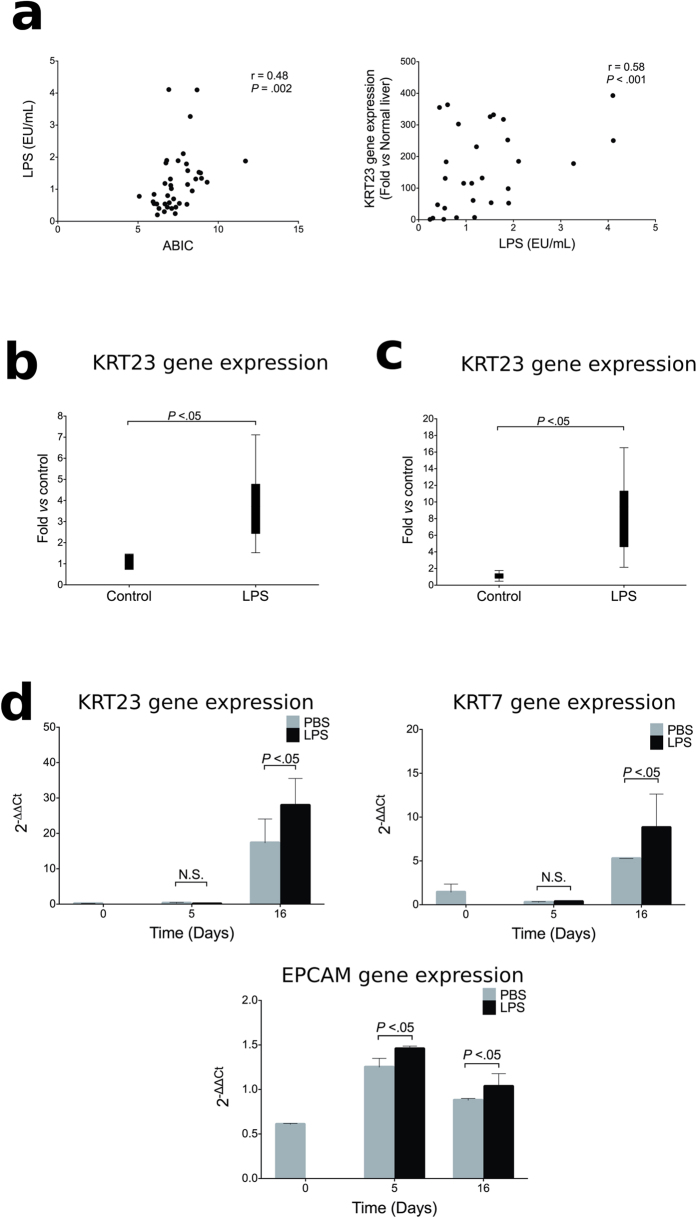
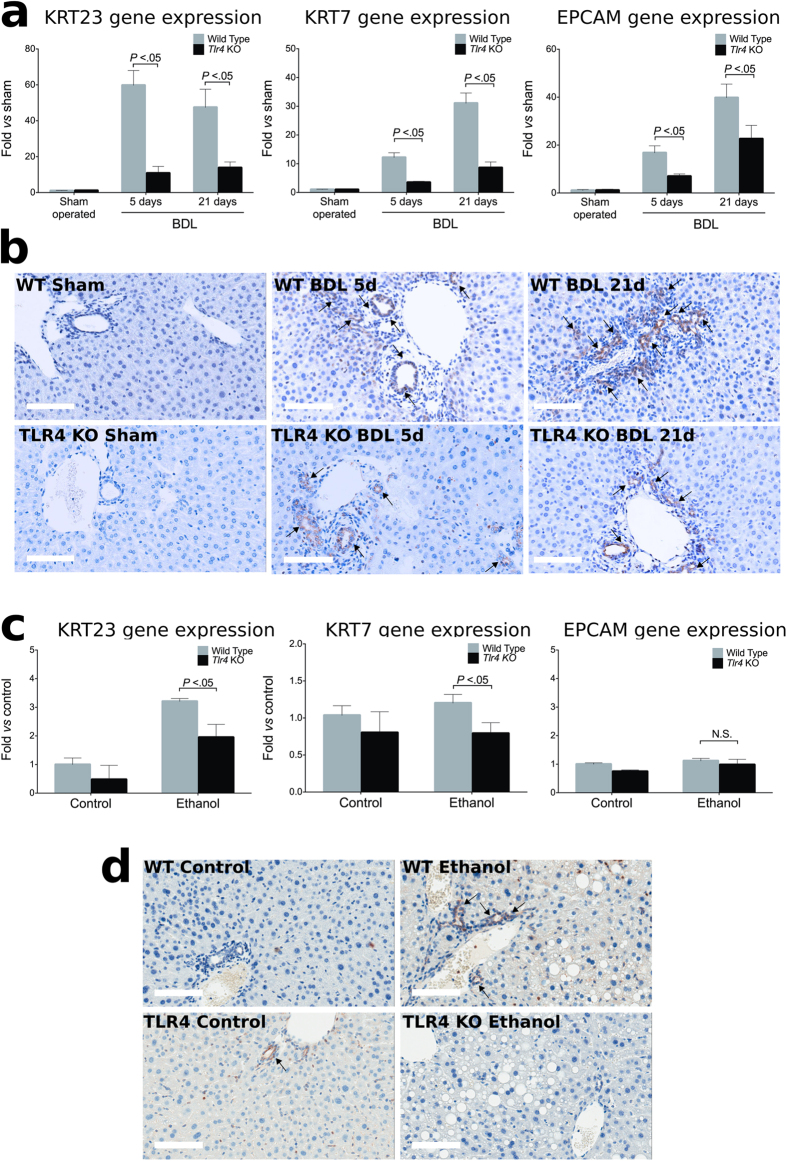
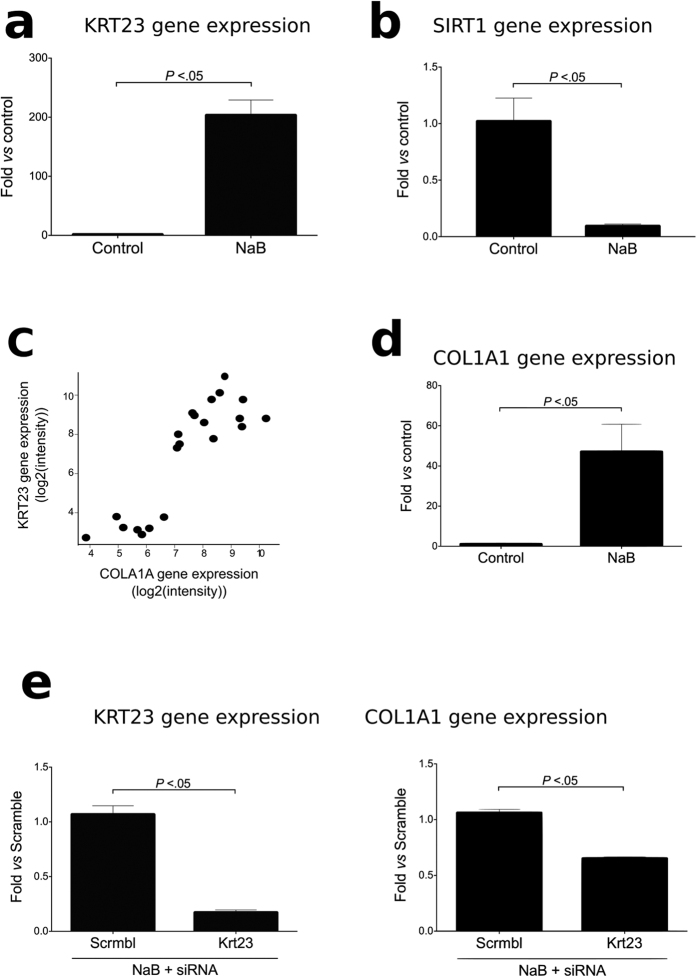
Alcoholic hepatitis (AH) is the most severe form of alcoholic liver disease for which there are no effective therapies. Patients with AH show impaired hepatocyte proliferation, expansion of inefficient ductular cells and high lipopolysaccharide (LPS) levels. It is unknown whether LPS mediates ductular cell expansion. We performed transcriptome studies and identified keratin 23 (KRT23) as a new ductular cell marker. KRT23 expression correlated with mortality and LPS serum levels. LPS-TLR4 pathway role in ductular cell expansion was assessed in human and mouse progenitor cells, liver slices and liver injured TLR4 KO mice. In AH patients, ductular cell expansion correlated with portal hypertension and collagen expression. Functional studies in ductular cells showed that KRT23 regulates collagen expression. These results support a role for LPS-TLR4 pathway in promoting ductular reaction in AH. Maneuvers aimed at decreasing LPS serum levels in AH patients could have beneficial effects by preventing ductular reaction development.
Figures
Similar articles
-
LPS-TLR4 pathway exaggerates alcoholic hepatitis via provoking NETs formation.Gastroenterol Hepatol. 2024 Feb;47(2):158-169. doi: 10.1016/j.gastrohep.2023.05.002. Epub 2023 May 5. Gastroenterol Hepatol. 2024. PMID: 37150251 English, Spanish.
-
Progenitor cell expansion and impaired hepatocyte regeneration in explanted livers from alcoholic hepatitis.Gut. 2015 Dec;64(12):1949-60. doi: 10.1136/gutjnl-2014-308410. Epub 2015 Mar 2. Gut. 2015. PMID: 25731872 Free PMC article.
-
[Effects of soothing liver and invigorating spleen recipes on LPS-induced hepatocytes injury of rats and TLR4/p38MAPK signal pathway].Zhongguo Zhong Yao Za Zhi. 2014 Oct;39(20):4027-33. Zhongguo Zhong Yao Za Zhi. 2014. PMID: 25751957 Chinese.
-
Ductular proliferation in liver tissues with severe chronic hepatitis B: an immunohistochemical study.World J Gastroenterol. 2006 Mar 7;12(9):1443-6. doi: 10.3748/wjg.v12.i9.1443. World J Gastroenterol. 2006. PMID: 16552818 Free PMC article.
-
Hepatic toll-like receptor 4 expression is associated with portal inflammation and fibrosis in patients with NAFLD.Liver Int. 2015 Feb;35(2):569-81. doi: 10.1111/liv.12531. Epub 2014 Apr 5. Liver Int. 2015. PMID: 24649857
Cited by
-
Acquisition of epithelial plasticity in human chronic liver disease.Nature. 2024 Jun;630(8015):166-173. doi: 10.1038/s41586-024-07465-2. Epub 2024 May 22. Nature. 2024. PMID: 38778114 Free PMC article.
-
Nine-gene signature and nomogram for predicting survival in patients with head and neck squamous cell carcinoma.Front Genet. 2022 Aug 24;13:927614. doi: 10.3389/fgene.2022.927614. eCollection 2022. Front Genet. 2022. PMID: 36092911 Free PMC article.
-
Hepatic lipocalin 2 promotes liver fibrosis and portal hypertension.Sci Rep. 2020 Sep 23;10(1):15558. doi: 10.1038/s41598-020-72172-7. Sci Rep. 2020. PMID: 32968110 Free PMC article.
-
Identification of Keratin 23 as a Hepatitis C Virus-Induced Host Factor in the Human Liver.Cells. 2019 Jun 18;8(6):610. doi: 10.3390/cells8060610. Cells. 2019. PMID: 31216713 Free PMC article.
-
Pathogenesis, Early Diagnosis, and Therapeutic Management of Alcoholic Liver Disease.Int J Mol Sci. 2019 Jun 2;20(11):2712. doi: 10.3390/ijms20112712. Int J Mol Sci. 2019. PMID: 31159489 Free PMC article. Review.
References
-
- Global Status Report on Alcohol and Health–2014 ed., 390 (World Health Organization, Geneva, Switzerland, 2014).
-
- Altamirano J. et al.. Acute kidney injury is an early predictor of mortality for patients with alcoholic hepatitis. Clinical gastroenterology and hepatology: the official clinical practice journal of the American Gastroenterological Association 10, 65–71 e63, 10.1016/j.cgh.2011.09.011 (2012). - DOI - PubMed
Publication types
MeSH terms
Substances
Grants and funding
LinkOut - more resources
Full Text Sources
Other Literature Sources
Molecular Biology Databases
Research Materials
