. 2016 Oct 12:9:32.
doi: 10.1186/s13040-016-0111-7. eCollection 2016.

Low-mass-ion discriminant equation (LOME) for ovarian cancer screening

Affiliations

Low-mass-ion discriminant equation (LOME) for ovarian cancer screening

Jun Hwa Lee et al. BioData Min. .

Abstract

Background: A low-mass-ion discriminant equation (LOME) was constructed to investigate whether systematic low-mass-ion (LMI) profiling could be applied to ovarian cancer (OVC) screening.

Results: Matrix-assisted laser desorption/ionization-time of flight (MALDI-TOF) mass spectrometry was performed to obtain mass spectral data on metabolites detected as LMIs up to a mass-to-charge ratio (m/z) of 2500 for 1184 serum samples collected from healthy individuals and patients with OVC, other types of cancer, or several types of benign tumor. Principal component analysis-based discriminant analysis and two search algorithms were employed to identify discriminative low-mass ions for distinguishing OVC from non-OVC cases. OVC LOME with 13 discriminative LMIs produced excellent classification results in a validation set (sensitivity, 93.10 %; specificity, 100.0 %). Among 13 LMIs showing differential mass intensities in OVC, 3 metabolic compounds were identified and semi-quantitated. The relative amount of LPC 16:0 was somewhat decreased in OVC, but not significantly so. In contrast, D,L-glutamine and fibrinogen alpha chain fragment were significantly increased in OVC compared to the control group (p = 0.001 and 0.002, respectively).

Conclusion: The present study suggested that OVC LOME might be a useful non-invasive tool with high sensitivity and specificity for OVC screening. The LOME approach could enable screening for multiple diseases, including various types of cancer, based on a single blood sample. Furthermore, the serum levels of three metabolic compounds-D,L-glutamine, LPC 16:0 and fibrinogen alpha chain fragment-might facilitate screening for OVC.

Keywords: MALDI-TOF mass spectrometry; Ovarian cancer; Pattern recognition; Screening; Serum profiling.


Figures

Fig. 1
Fig. 1
Search algorithm 2
Fig. 2
Fig. 2
Classification results for the reference mass spectrum. a Principal component analysis-based discriminant analysis. b Preliminary low-mass-ion candidates. DS, discriminant score; OVC, ovarian cancer; CRC, colorectal cancer; GC, gastric cancer; BUT, benign uterine tumor; BOT, benign ovarian tumor; PCL, precancerous cervical lesion; BRC, breast cancer; and BBT, benign breast tumor
Fig. 3
Fig. 3
Classification results using the 13 discriminative low-mass ions. a Set A1. b Set A2. c Set B. Sets A1 and A2 are the training sets for the two-stage training scheme. Set B is the validation set. DS, discriminant score; OVC, ovarian cancer; CRC, colorectal cancer; GC, gastric cancer; BUT, benign uterine tumor; BOT, benign ovarian tumor; PCL, precancerous cervical lesion; BRC, breast cancer; and BBT, benign breast tumor
Fig. 4
Fig. 4
Classification results using the 13 discriminative and 3 identified low-mass ions. a Set A1. b Set A2. c Set B. Sets A1 and A2 are the training sets for the two-stage training scheme. Set B is the validation set. DS, discriminant score; OVC, ovarian cancer; CRC, colorectal cancer; GC, gastric cancer; BUT, benign uterine tumor; BOT, benign ovarian tumor; PCL, precancerous cervical lesion; BRC, breast cancer; and BBT, benign breast tumor
Fig. 5
Fig. 5
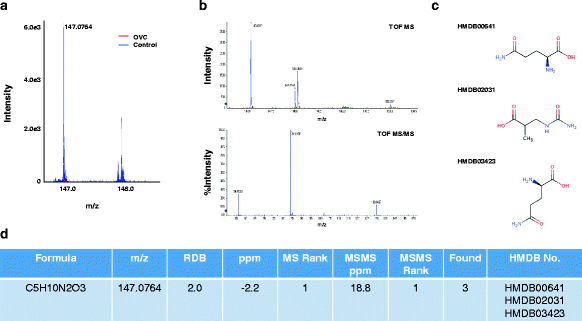
Selection of candidate metabolites for the LMI with 147.0764 m/z. a Mass spectra of 147.0764 m/z. MS and MS/MS pattern analyses were performed using a Triple-TOF mass spectrometer. The LMI with 147.1699 m/z in the MALDI mass spectrum was shifted to 147.0764 m/z in the Triple-TOF mass spectrum. The intensity of the LMI with 147.0764 m/z was significantly higher in the control group (peaks in blue) compared to the OVC group (peaks in red). b MS/MS analysis of the LMI with 147.0764 m/z. c Structure of HMDB00641 (L-glutamine), HMDB02031 (ureidoisobutyric acid) and HMDB03423 (D-glutamine). d HMDB number of the LMI with 147.0764 m/z. Based on the MS/MS analytic pattern, three metabolic compounds—HMDB00641 (L-glutamine), HMDB02031 (ureidoisobutyric acid) and HMDB03423 (D-glutamine)—for the LMI with 147.0764 m/z were selected
Fig. 6
Fig. 6
Identification of the LMI with 496.3398 m/z. a Mass spectra of 496.3398 m/z. MS and MS/MS pattern analyses were performed using a Triple-TOF mass spectrometer. The intensity of the LMI with 496.3398 m/z was significantly higher in the control group (peaks in blue) compared to the OVC group (peaks in red). b MS/MS analysis of the LMI with 496.3398 m/z. c Structure of HMDB10382 (LPC 16:0). d HMDB number of the LMI with 496.3398 m/z. Based on the MS/MS analytic pattern, the metabolic compound with 496.3398 m/z was identified as HMDB10382 (LPC 16:0)
Fig. 7
Fig. 7
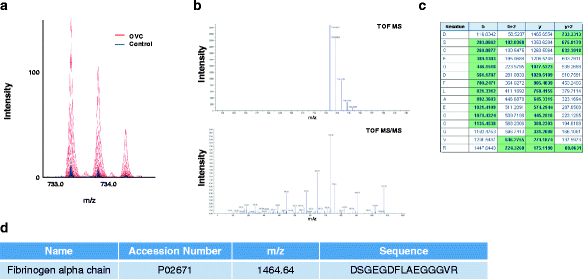
Identification of the LMI with 1464.64 m/z. a Mass spectra of 1464.64 m/z. MS and MS/MS pattern analyses were performed using a Triple-TOF mass spectrometer. The intensity of the LMI with 1464.64 m/z was significantly higher in the OVC group (peaks in red) compared to the control group (peaks in blue). b MS/MS analysis of the LMI with 1464.64 m/z. c Peptide sequence analysis demonstrating that the LMI with 1464.64 m/z was the fibrinogen alpha chain fragment. Protein identification based on the MS/MS analytic pattern. d The LMI with 1464.64 m/z was identified as the fibrinogen alpha chain fragment
Fig. 8
Fig. 8
Semi-quantitative analysis of D,L-glutamine, LPC 16:0 and fibrinogen alpha chain fragment using peak areas in Triple-TOF mass spectra. Control (n = 73), OVC (n = 13), and GC (n = 9) samples were further analyzed using Triple-TOF MS for semi-quantitation of the three identified LMIs [a D,l-glutamine, b LPC 16:0, and c fibrinogen alpha chain fragment]. Left panels show the peak areas of D,l-glutamine, LPC 16:0, and fibrinogen alpha chain fragment from individuals. Right panels are the results of statistical analysis demonstrating differential levels of the three molecules in the OVC group

References

    1. Clarke-Pearson DL. Clinical practice. Screening for ovarian cancer. N Engl J Med. 2009;361:170–177. doi: 10.1056/NEJMcp0901926. - DOI - PubMed
    1. Reade CJ, Riva JJ, et al. Risks and benefits of screening asymptomatic women for ovarian cancer: a systematic review and meta-analysis. Gynecol Oncol. 2013;130:674–681. doi: 10.1016/j.ygyno.2013.06.029. - DOI - PubMed
    1. Lu KH, Skates S, et al. A 2-stage ovarian cancer screening strategy using the Risk of Ovarian Cancer Algorithm (ROCA) identifies early-stage incident cancers and demonstrates high positive predictive value. Cancer. 2013;119:3454–3461. doi: 10.1002/cncr.28183. - DOI - PMC - PubMed
    1. DeBerardinis RJ, Thompson CB. Cellular metabolism and disease: what do metabolic outliers teach us? Cell. 2012;148:1132–1144. doi: 10.1016/j.cell.2012.02.032. - DOI - PMC - PubMed
    1. Beger RD. A review of applications of metabolomics in cancer. Metabolites. 2013;3:552–574. doi: 10.3390/metabo3030552. - DOI - PMC - PubMed

LinkOut - more resources