. 2016 Aug 12:8:85.
doi: 10.1186/s13148-016-0251-0. eCollection 2016.

Histone modification signature at myeloperoxidase and proteinase 3 in patients with anti-neutrophil cytoplasmic autoantibody-associated vasculitis

Affiliations

Histone modification signature at myeloperoxidase and proteinase 3 in patients with anti-neutrophil cytoplasmic autoantibody-associated vasculitis

Jiajin Yang et al. Clin Epigenetics. .

Abstract

Background: Anti-neutrophil cytoplasmic autoantibody (ANCA)-associated vasculitis (AAV) is a systemic autoimmune disease characterized by destructive vascular inflammation. Two prominent ANCA autoantigens are myeloperoxidase (MPO) and proteinase 3 (PR3), and transcription of MPO and PRTN3, the genes encoding the autoantigens, is associated with disease activity. We investigated whether patients with AAV have alterations in histone modifications, particularly those associated with transcriptional activation, at MPO and PRTN3.

Results: We identified a network of genes regulating histone modifications that were differentially expressed in AAV patients compared to healthy controls. We focused on four genes (EHMT1 and EHMT2, ING4, and MSL1) and found their expression correlated with expression of MPO and PRTN3. Methylation of histone H3K9, catalyzed by EHMT1 and EHMT2 and associated with gene silencing, was most depleted at MPO and PRTN3 in patients with active disease and the highest MPO and PRTN3 expression. Acetylation of histone H4K16, modified by complexes containing ING4 and MSL1 and associated with gene activation, was most enriched at MPO and PRTN3 in patients with active disease and the highest MPO and PRTN3 expression. Methylation at H3K4, a mark of transcriptional activation, was enriched at MPO and PRTN3 in patients and healthy controls.

Conclusions: MPO and PRTN3 in neutrophils of AAV patients with active disease have a distinct pattern of histone modifications, which implicates epigenetic mechanisms in regulating expression of autoantigen genes and suggests that the epigenome may be involved in AAV pathogenesis.

Keywords: ANCA-associated vasculitis; Autoantigens; Epigenetics; Gene expression; Neutrophils.


Figures

Fig. 1
Fig. 1
Bioinformatic analysis of microarray gene expression data comparing leukocytes from AAV patients to healthy controls. a Principal component analysis of the gene expression profile is shown for AAV patients, represented by red dots, and for healthy controls, represented by blue dots. b Gene expression data was processed with Ingenuity Pathway Analysis software to unveil biological networks. The primary network shown is for genes with functional annotations related to histone, histone H3, and/or histone H4. Genes with increased or decreased expression in AAV patients compared to healthy controls are shown in red and green, respectively
Fig. 2
Fig. 2
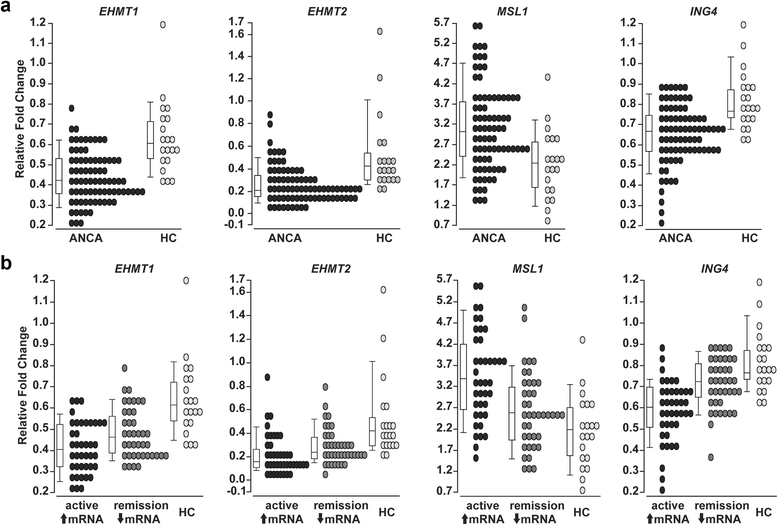
Quantitative RT-PCR analysis of candidate genes in leukocytes from AAV patients and health controls. a Quantitative RT-PCR was performed on RNA isolated from total leukocytes of AAV patients (n = 80, black ovals) and healthy controls (HC; n = 20, light gray ovals). Expression is reported as a relative fold change for EHMT1 (ANCA 0.51 ± 0.12 versus HC 0.69 ± 0.17, p < 0.0001), EHMT2 (ANCA 0.26 ± 0.17 versus HC 0.51 ± 0.35, p < 0.0001), MSL1 (ANCA 3.07 ± 1.07 versus HC 2.16 ± 0.89, p = 0.0009), and ING4 (ANCA 0.63 ± 0.14 versus HC 0.79 ± 0.14, p < 0.0001). b AAV patients were divided into two groups: (1) patients with active disease (BVAS ≥ 3) and high expression of autoantigen genes PRTN3 and MPO (↑mRNA, black ovals, n = 40), (2) patients in remission (BVAS = 0) and low expression of autoantigen genes PRTN3 and MPO (↓mRNA, gray ovals, n = 40). Expression comparing AAV patients with active disease and AAV patients in remission is reported as a relative fold change for EHMT1 (↑mRNA 0.47 ± 0.11 versus ↓mRNA 0.54 ± 0.11, p = 0.0172), EHMT2 (↑mRNA 0.22 ± 0.17 versus ↓mRNA 0.29 ± 0.15, p = 0.0074), MSL1 (↑mRNA 3.49 ± 1.07 versus ↓mRNA 2.64 ± 0.91, p = 0.0004), and ING4 (↑mRNA 0.57 ± 0.14 versus ↓mRNA 0.69 ± 0.11, p < 0.0001). (Note: the median expression value is represented by the line in the box of the box and whisker plot, while mean ± standard deviation is listed in figure legend)
Fig. 3
Fig. 3
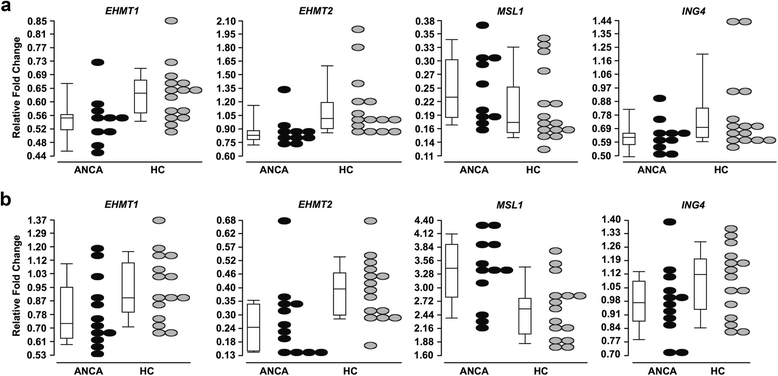
Quantitative RT-PCR analysis of candidate genes in purified monocytes and neutrophils from AAV patients and health controls. a Quantitative RT-PCR was performed on RNA isolated from monocytes of AAV patients (n = 10, black ovals) and healthy controls (HC; n = 15, light gray ovals). Expression is reported as a relative fold change for EHMT1 (ANCA 0.55 ± 0.08 versus HC 0.63 ± 0.09, p = 0.0213), EHMT2 (ANCA 0.88 ± 0.19 versus HC 1.15 ± 0.35, p = 0.0043), MSL1 (ANCA 0.21 ± 0.07 versus HC 0.25 ± 0.07, p = 0.192), and ING4 (ANCA 0.64 ± 0.12 versus HC 0.80 ± 0.29, p = 0.102). b Quantitative RT-PCR was performed on RNA isolated from neutrophils of AAV patients (n = 12, black ovals) and healthy controls (HC; n = 15, light gray ovals). Expression is reported as a relative fold change for EHMT1 (ANCA 0.80 ± 0.22 versus HC 0.95 ± 0.21, p = 0.0481), EHMT2 (ANCA 0.28 ± 0.16 versus HC 0.40 ± 0.13, p = 0.0043), MSL1 (ANCA 3.35 ± 0.74 versus HC 2.55 ± 0.63, p = 0.0157), and ING4 (ANCA 0.98 ± 0.19 versus HC 1.08 ± 0.18, p = 0.180). (Note: the median expression value is represented by the line in the box of the box and whisker plot, while mean ± standard deviation is listed in figure legend)
Fig. 4
Fig. 4
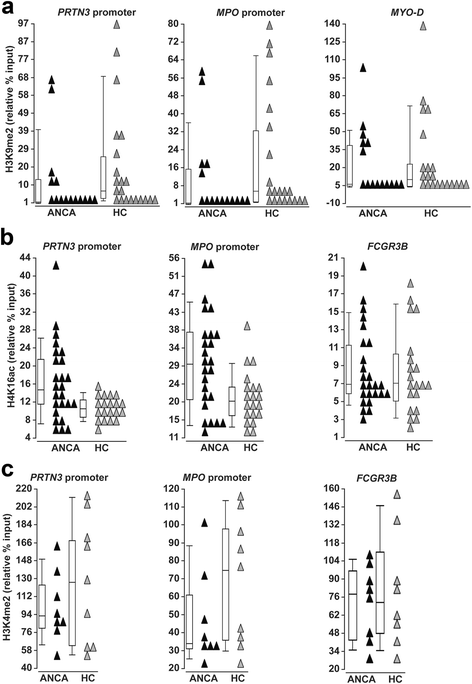
Chromatin immunoprecipitation (ChIP)-quantitative PCR analysis for histone modifications at autoantigen genes in AAV patients and healthy controls. a ChIP-qPCR was performed on AAV patients (ANCA, black triangles, n = 15) and healthy controls (HC; gray triangles, n = 21) for H3K9me2. The level of the H3K9me2 modification is reported as relative percent of input at the PRTN3 promoter (ANCA 12.44 ± 22.10, HC 21.17 ± 28.55; p = 0.0192), MPO promoter (ANCA 11.37 ± 19.01, HC 20.01 ± 28.55; p = 0.0247), and a control gene, MYO-D (ANCA 21.42 ± 28.78, HC 23.63 ± 35.53; p = 0.702). b ChIP-qPCR for H4K16ac was performed on AAV patients (ANCA, black triangles, n = 25) and healthy controls (HC; gray triangles, n = 20). The level of the H4K16ac modification is reported as relative percent of input at the PRTN3 promoter (ANCA 17.10 ± 9.14, HC 10.83 ± 2.73; p = 0.0116), MPO promoter (ANCA 30.30 ± 12.89, HC 21.06 ± 6.67; p = 0.0132) and at a control gene, FCGR3B (ANCA 9.19 ± 4.74, HC 8.83 ± 5.14, p = 0.864). c ChIP-qPCR for H3K4me2 was performed on AAV patients (ANCA, black triangles, n = 8) and healthy controls (HC, gray triangles, n = 8). The level of the H3K4me2 modification is reported as relative percent of input at the PRTN3 promoter (ANCA 50.68 ± 18.15, HC 63.78 ± 32.86, p = 0.532), MPO promoter (ANCA 24.17 ± 14.80, HC 36.09 ± 18.88, p = 0.136), and at a control gene, FCGR3B (ANCA 74.01 ± 30.26, HC 82.74 ± 46.52, p = 0.878) (Note: the level of the indicated histone modification was calculated using raw Ct values from qPCR of diluted input sample. The median expression value is represented by the line in the box of the box and whisker plot, while mean ± standard deviation is listed in figure legend)
Fig. 5
Fig. 5
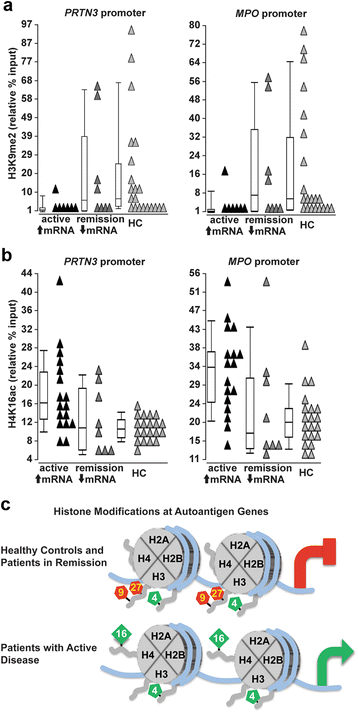
ChIP-quantitative PCR analysis for histone modifications at autoantigen genes in ANCA-patients with high and low PRTN3 and MPO expression. a The level of H3K9me2 is reported as relative percent input for AAV patients with active disease (BVAS ≥ 3) and high expression of PRTN3 and MPO (↑mRNA, black triangles, n = 7) and for healthy controls (HC; light gray triangles, n = 21) at the PRTN3 promoter (↑mRNA 3.41 ± 5.20, HC 21.17 ± 28.55; p = 0.0068) and the MPO promoter (↑mRNA 3.34 ± 6.02, HC 20.01 ± 26.00; p = 0.0058). The level of H3K9me2 is reported as relative percent input for AAV patients in remission (BVAS = 0) and low expression of PRTN3 and MPO (↓mRNA, gray triangles, n = 8) for healthy controls at the PRTN3 promoter (↓mRNA 20.33 ± 28.30, HC 21.17 ± 28.55; p = 0.294) and at the MPO promoter (↓mRNA 18.41 ± 23.88, HC 20.01 ± 26.00; p = 0.393). b The level of H4K16ac is reported as relative percent input for AAV patients with active disease (BVAS ≥ 3) and high expression of PRTN3 and MPO (↑mRNA, black triangles, n = 17) and for healthy controls (HC; light gray triangles, n = 20) at the PRTN3 promoter (↑mRNA 19.12 ± 9.31, HC 10.83 ± 2.73; p = 0.0009) and the MPO promoter (↑mRNA 33.26 ± 11.03, HC 21.56 ± 6.67; p = 0.0006). The level of H4K16ac is reported as relative percent input for AAV patients in remission (BVAS = 0) and low expression of PRTN3 and MPO (↓mRNA, gray triangles, n = 8) for healthy controls at the PRTN3 promoter (↓mRNA 12.81 ± 7.55, HC 10.83 ± 2.73; p = 0.939) and at the MPO promoter (↓mRNA 24.02 ± 15.02, HC 21.56 ± 6.67; p = 0.859). (Note: the level of the indicated histone modification was calculated using raw Ct values from qPCR of diluted input sample. The median expression value is represented by the line in the box of the box and whisker plot, while mean ± standard deviation is listed in figure legend.) c Illustration depicts a model for modifications of histone tails at promoters of PRTN3 and MPO in healthy controls and AAV patients in remission (top), and in AAV patients with active disease (bottom)

References

    1. Falk RJ, Terrell RS, Charles LA, Jennette JC. Anti-neutrophil cytoplasmic autoantibodies induce neutrophils to degranulate and produce oxygen radicals in vitro. Proc Nat Acad Sci U S A. 1990;87(11):4115–4119. doi: 10.1073/pnas.87.11.4115. - DOI - PMC - PubMed
    1. Little MA, Al-Ani B, Ren S, Al-Nuaimi H, Leite M, Jr, Alpers CE, et al. Anti-proteinase 3 anti-neutrophil cytoplasm autoantibodies recapitulate systemic vasculitis in mice with a humanized immune system. PloS One. 2012;7(1) doi: 10.1371/journal.pone.0028626. - DOI - PMC - PubMed
    1. Xiao H, Heeringa P, Hu P, Liu Z, Zhao M, Aratani Y, et al. Antineutrophil cytoplasmic autoantibodies specific for myeloperoxidase cause glomerulonephritis and vasculitis in mice. J Clin Invest. 2002;110(7):955–963. doi: 10.1172/JCI0215918. - DOI - PMC - PubMed
    1. Pfister H, Ollert M, Frohlich LF, Quintanilla-Martinez L, Colby TV, Specks U, et al. Antineutrophil cytoplasmic autoantibodies against the murine homolog of proteinase 3 (Wegener autoantigen) are pathogenic in vivo. Blood. 2004;104(5):1411–1418. doi: 10.1182/blood-2004-01-0267. - DOI - PubMed
    1. Thai LH, Charles P, Resche-Rigon M, Desseaux K, Guillevin L. Are anti-proteinase-3 ANCA a useful marker of granulomatosis with polyangiitis (Wegener’s) relapses? Results of a retrospective study on 126 patients. Autoimmun Rev. 2014;13(3):313–318. doi: 10.1016/j.autrev.2013.11.003. - DOI - PubMed

Publication types

MeSH terms