. 2016 Oct;3(4):045003.
doi: 10.1117/1.NPh.3.4.045003. Epub 2016 Oct 12.

Intraoperative video-rate hemodynamic response assessment in human cortex using snapshot hyperspectral optical imaging

Affiliations

Intraoperative video-rate hemodynamic response assessment in human cortex using snapshot hyperspectral optical imaging

Julien Pichette et al. Neurophotonics. 2016 Oct.

Abstract

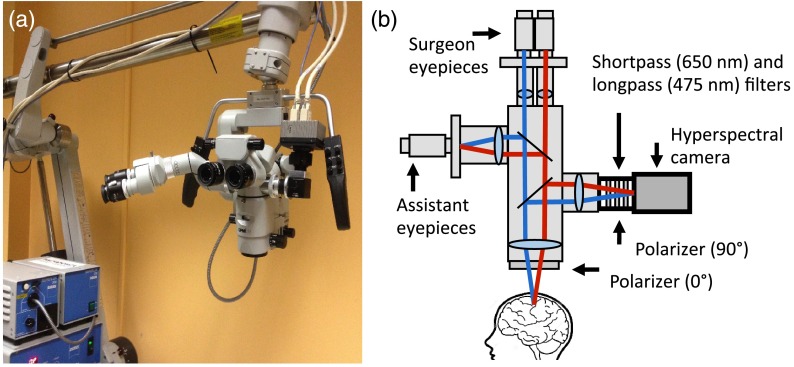
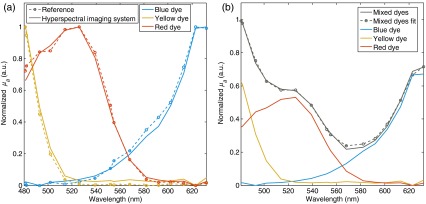
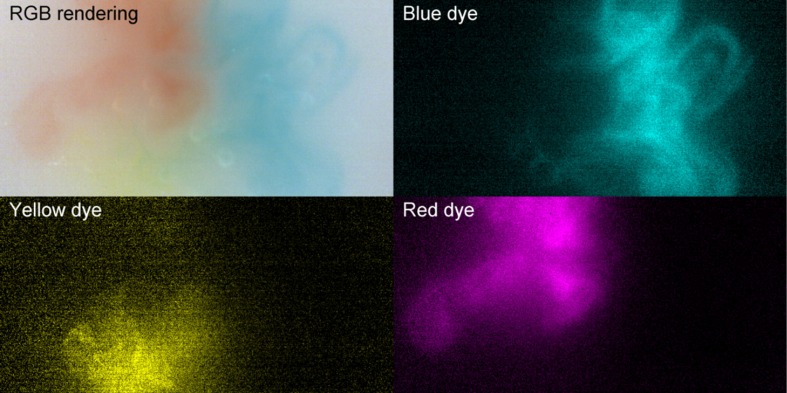
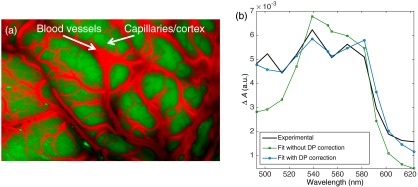
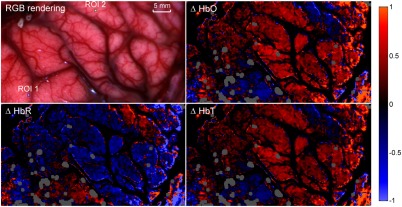
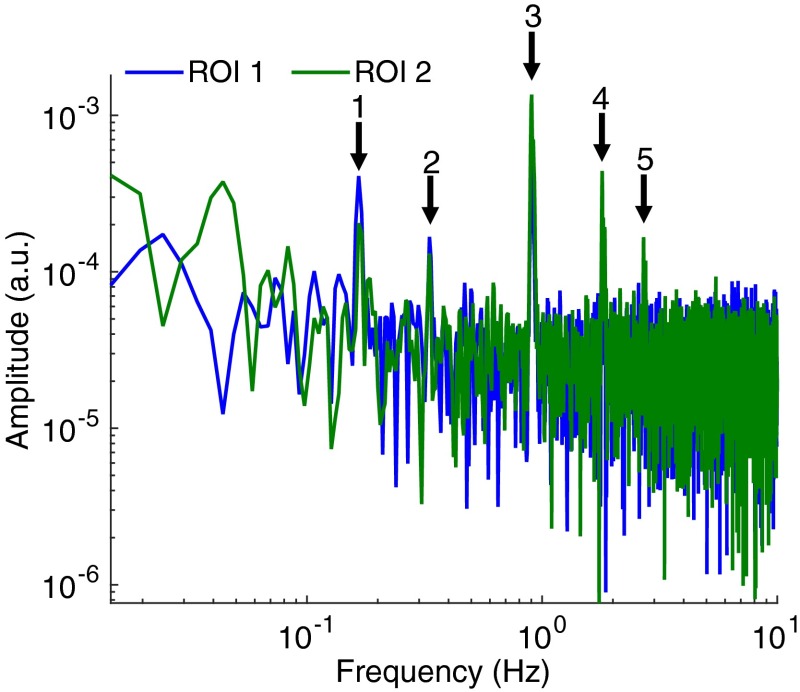
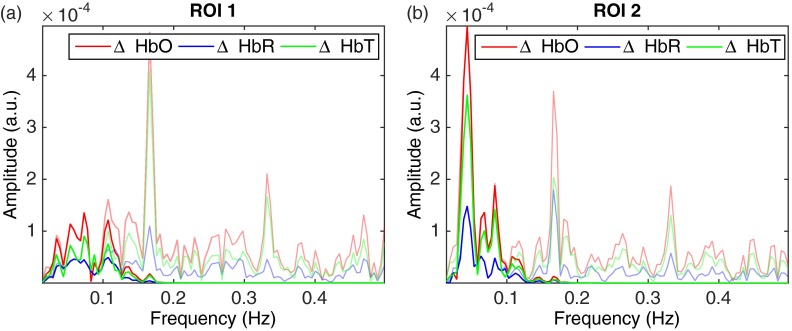
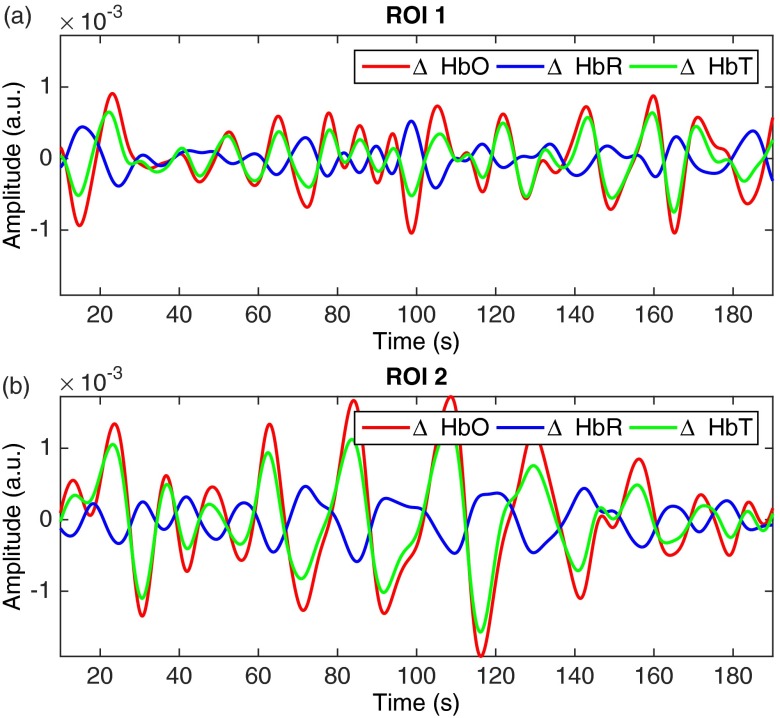
Using light, we are able to visualize the hemodynamic behavior of the brain to better understand neurovascular coupling and cerebral metabolism. In vivo optical imaging of tissue using endogenous chromophores necessitates spectroscopic detection to ensure molecular specificity as well as sufficiently high imaging speed and signal-to-noise ratio, to allow dynamic physiological changes to be captured, isolated, and used as surrogate of pathophysiological processes. An optical imaging system is introduced using a 16-bands on-chip hyperspectral camera. Using this system, we show that up to three dyes can be imaged and quantified in a tissue phantom at video-rate through the optics of a surgical microscope. In vivo human patient data are presented demonstrating brain hemodynamic response can be measured intraoperatively with molecular specificity at high speed.

Keywords: epilepsy; hemodynamic response; hyperspectral imaging; intraoperative imaging.


Figures

Fig. 1
Fig. 1
Neurosurgical imaging system. (a) Hyperspectral camera system connected to a side-port of the neurosurgical microscope. (b) Schematics of the imaging system affixed onto a free optical port.
Fig. 2
Fig. 2
Tissue phantom experiments. (a) Calibrated spectra (blue, yellow, and red dyes) acquired with the hyperspectral imaging system compared with reference absorption spectra of pure dyes measured using a custom spectrophotometer. (b) Shown in gray are data representing measured (plain line) and fitted (circle markers) spectra of a phantom containing a mixture of the three dyes. The red, yellow, and red curves represent the fitted spectra for each dye with the amplitude representative of their relative concentrations.
Fig. 3
Fig. 3
Spectral unmixing of three dyes (blue, yellow, and red) live during video acquisition. The top-left image is a reconstituted RGB image and the other quadrants show relative dye concentration in cyan, yellow, and magenta (for full video see Video 1, MP4, 15.1 Mb). Real-time spectral unmixing of three dyes (blue, yellow, and red) (MPEG, 5.9 Mb) [URL: http://dx.doi.org/10.1117/1.NPH.3.4.045003.1].
Fig. 4
Fig. 4
(a) False-color image of segmented blood vessels (red) and regions with capillaries and cortex. (b) Absorbance changes for one ROI calculated relative to the average reflectance spectra of this ROI. The HbO and HbR absorption spectra were fitted to the experimental data (black line) with (blue-circle markers) and without (green-square markers) differential pathlength (DP) correction.
Fig. 5
Fig. 5
In vivo relative concentration maps of oxygenated hemoglobin (HbO), deoxygenated hemoblogin (HbR), and total hemoglobin content (HbT) of surface cortex during intraoperative acquisitions. The top-left image is a reconstituted RGB image where two regions of interest are shown (ROI 1 and ROI 2) where further analysis was made (for full video see Video 2). Real-time in vivo relative concentration maps of oxygenated hemoglobin (HbO), deoxygenated hemoblogin (HbR), and total hemoglobin content (HbT) of surface cortex during intraoperative acquisitions (MPEG, 9.2 Mb) [URL: http://dx.doi.org/10.1117/1.NPH.3.4.045003.2].
Fig. 6
Fig. 6
Frequency spectrum of the hemodynamic response in the two representative regions of interest (ROI 1 and ROI 2) shown in Fig. 4. Areas of increased spectral power density are highlighted corresponding to: breathing and one of its harmonic components (peaks 1 and 2), heart rate and harmonic components (peaks 3, 4, and 5).
Fig. 7
Fig. 7
Frequency spectra for ROI 1 (a) and ROI 2 (b) in Fig. 4 with the low frequencies (<0.15  Hz) represented in darker colors: HbO (red), HbR (blue), and HbT (green). The >0.15  Hz power density spectrum is also shown in the background.
Fig. 8
Fig. 8
Time-sequences of the hemodynamics associated with the <0.15  Hz frequency components for (a) ROI 1 and (b) ROI 2 (see Fig. 4): HbO (red), HbR (blue), HbT (green).

References

    1. Hillman E. M. C., “Optical brain imaging in vivo: techniques and applications from animal to man,” J. Biomed. Opt. 12(5), 051402 (2007).JBOPFO10.1117/1.2789693 - DOI - PMC - PubMed
    1. Scholkmann F., et al. , “A review on continuous wave functional near-infrared spectroscopy and imaging instrumentation and methodology,” Neuroimage 85, 6–27 (2014).NEIMEF10.1016/j.neuroimage.2013.05.004 - DOI - PubMed
    1. Lavine M., Haglund M. M., Hochman D. W., “Dynamic linear model analysis of optical imaging data acquired from the human neocortex,” J. Neurosci. Methods 199(2), 346–362 (2011).JNMEDT10.1016/j.jneumeth.2011.05.017 - DOI - PMC - PubMed
    1. Zhao M., et al. , “Focal increases in perfusion and decreases in hemoglobin oxygenation precede seizure onset in spontaneous human epilepsy,” Epilepsia 48(11), 2059–2067 (2007).EPILAK10.1111/j.1528-1167.2007.01229.x - DOI - PubMed
    1. Haglund M. M., Hochman D. W., “Optical imaging of epileptiform activity in human neocortex,” Epilepsia 45 Suppl 4(8), 43–47 (2004).EPILAK10.1111/j.0013-9580.2004.04010.x - DOI - PubMed