. 2016 Oct 18;52(85):12555-12569.
doi: 10.1039/c6cc05613j.

Nanoscale chirality in metal and semiconductor nanoparticles

Affiliations

Nanoscale chirality in metal and semiconductor nanoparticles

Jatish Kumar et al. Chem Commun (Camb). .

Abstract

The field of chirality has recently seen a rejuvenation due to the observation of chirality in inorganic nanomaterials. The advancements in understanding the origin of nanoscale chirality and the potential applications of chiroptical nanomaterials in the areas of optics, catalysis and biosensing, among others, have opened up new avenues toward new concepts and design of novel materials. In this article, we review the concept of nanoscale chirality in metal nanoclusters and semiconductor quantum dots, then focus on recent experimental and theoretical advances in chiral metal nanoparticles and plasmonic chirality. Selected examples of potential applications and an outlook on the research on chiral nanomaterials are additionally provided.


Figures

Fig. 1
Fig. 1. Chirality in metallic, semiconductor and plasmonic nanostructures and assemblies: (a) X-ray structure of enantiomers of [Ag46Au24(SR)32](BPh4)2 NCs. Reproduced with permission from ref. 58. Copyright 2015 American Association for the Advancement of Science. (b) Optimized geometries of l- and d-cysteine capped semiconductor CdSe nanocrystals. Reproduced with permission from ref. 74. Copyright 2013 American Chemical Society. (c) TEM images of left- and right-handed gold nanohelices. Reproduced with permission from ref. 89. Copyright 2009 American Association for the Advancement of Science. (d) TEM tomography images of left- and right-handed gold NP double helices formed on a peptide template. Reproduced with permission from ref. 132. Copyright 2013 American Chemical Society.
Fig. 2
Fig. 2. (a) CD response at 345 nm for the racemization of enantiopure Au38(SCH2CH2Ph)24 at different temperatures. The response is negative at 345 nm and approaches zero with time; the rate increases with temperature. The inset shows the schematic representation (created using crystallographic data) of the racemization reaction along the principal axis of the cluster. Reproduced with permission from ref. 53. Copyright 2012 American Chemical Society. (b) CD spectra and model of enantiopure metal cluster complexes. Molecular structures of the three 1,2-diamine ligands (one enantiomer) used for the synthesis of chiral clusters. Reproduced with permission from ref. 55. Copyright 2016 American Chemical Society.
Fig. 3
Fig. 3. (a) X-ray crystallography structure of the chiral gold NC [Au20(PP3)4]Cl4 (PP3 = tris(2-(diphenylphosphino)ethyl)phosphine), showing the bridging mode of PP3. The 16 surface gold atoms are of six types (from A to F), the four interstitial Au atoms are shown in green, and phenyl groups are omitted for clarity. Reproduced with permission from ref. 41. Copyright 2014 Wiley-VCH. (b) X-ray crystallography structure of one of the enantiomers of a bimetallic chiral [Ag46Au24(SR)32](BPh4)2 NC. Gray: carbon; red: sulfur; green: silver; yellow: gold; pink: boron. The hydrogen atoms are omitted for the sake of clarity. Reproduced with permission from ref. 58. Copyright 2015 American Association for the Advancement of Science.
Fig. 4
Fig. 4. (a) Induced CD spectra of l- and d-cysteine capped CdSe QDs. Optimized geometries of the corresponding nanocrystals are also provided. Adapted with permission from ref. 74. Copyright 2011 American Chemical Society. (b) Schematic representation of l-cysteine (left) and N-acetyl-l-cysteine (right) capped CdSe QDs along with the corresponding CD spectra obtained for the two NPs showing signal inversion. Adapted with permission from ref. 75. Copyright 2016 American Chemical Society. (c) Atomistic models for CdSe/ZnS QDs with right (i) and left (ii) screw dislocations. (d and e) Spectra of induced (d) and intrinsic (e) CD in l- and d-CdSe/ZnS QDs. Absorption spectra are shown as dotted lines. Adapted with permission from ref. 60. Copyright 2015 American Chemical Society.
Fig. 5
Fig. 5. (a) CD (solid line) and g-factor (dotted line) spectra for solutions of left- and right-handed nanoribbons obtained after 50 h of illumination with circularly polarized light. (b and c) Representative 3D TEM tomographic reconstructions of left- (b) and right-handed (c) nanoribbons. Scale bars = 100 nm. Adapted with permission from ref. 76. Copyright 2015 Nature Publishing Group.
Fig. 6
Fig. 6. (a) Atomic force microscopy image of right-handed star-shaped gold nanostructures that were made chiral by curved, wedge-shaped spiral arms. Reproduced with permission from ref. 92. Copyright 2012, Optical Society of America. (b) TEM images of left- and right-handed gold nanohelices possessing two turns. Adapted with permission from ref. 93. Copyright 2013 Nature Publishing Group. (c) Electron micrograph of left-handed twisted-cross gold nanodimers consisting of two achiral crosses on top of each other. Reproduced with permission from ref. 94. Copyright 2011, Optical Society of America.
Fig. 7
Fig. 7. (a) Schematic illustration of a large Ag NP covered by a monolayer of molecules and a small NP stabilized with large molecular stacks. (b and c) CD spectra of Ag NPs coated with chiral molecules prepared from Ag : molecule ratios of (b) 32 : 1 (large NP) and (c) 8 : 1 (small NP), measured as a function of temperature. Insets show the respective extinction spectra, which undergo only small changes with temperature. Adapted with permission from ref. 99. Copyright 2012 American Chemical Society.
Fig. 8
Fig. 8. (a) Bisignated CD signals observed at the surface plasmon frequency with positive and negative couplets for NP bunches adsorbed on the surface of d- and l-diphenylalanine nanotubes. (b and c) TEM images of diphenylalanine peptide nanotubes (b) in the presence of Au NP seeds and (c) after photochemical irradiation for 3 h in the presence of HAuCl4 for reductive growth of NPs on the seeds. The inset shows the HRTEM image of one of the NP bunches. Adapted with permission from ref. 101. Copyright 2010 American Chemical Society. (d) Schematic illustration of plasmonic CD induction by chiral riboflavin molecules in the vicinity of gold islands deposited on a glass substrate. Chiral molecules induce optical activity in Au islands leading to CD signals at the metal plasmon resonance of 570 nm. Adapted with permission from ref. 107. Copyright 2013 American Chemical Society. (e) CD and UV-vis spectra of Au–(DNA–Ag)–Au trimers, and control experiments. The inset shows a TEM image and a scheme of the core–shell trimer nanostructure. Reproduced with permission from ref. 109. Copyright 2015 Wiley VCH.
Fig. 9
Fig. 9. (a) CD spectra of Au@Ag nanocuboids and nanoarrows with cysteine adsorbed on their surfaces and Au@Au NPs grown from cysteine modified Au nanorods (cysteine at the core–shell interface). Solid and dotted lines represent l- and d-cysteine, respectively. TEM images of the different Au@Ag NPs are also shown (scale bar = 20 nm). Reproduced with permission from ref. 110. Copyright 2016 Royal Society of Chemistry. (b) Schematic illustration of the inverse adsorption of a peptide on the surface of a nanocube, along with a high resolution TEM image of the cube. CD spectra of the nanocube with C-P8 (cysteine unit at the N terminus – black trace) and P8-C (cysteine unit at the C terminus – red trace). Reproduced with permission from ref. 111. Copyright 2016 American Chemical Society.
Fig. 10
Fig. 10. (a) Calculated normalized extinction CD, ε extin,CD/N NP, for optimized Au-NP helices with pitch = 25 nm. Other parameters: NP radius (a NP) = 5 nm and helix radius (R 0) = 12 nm. (b) Calculated normalized extinction CD at two selected wavelengths λ = 525 and λ = 555 nm. The selected wavelengths correspond to the extreme points of the CD spectra. (c) Calculated normalized extinction CD for 6-NP-per-turn helices with a variable pitch and a constant helical radius R 0 = 8.5 nm; number of NPs (N NP) = 13; and a NP = 2.5 nm. (d–f) Calculated normalized extinction CD for 6-NP-per-turn helices with various defects: a model of a perfect helix (d), the helix with one missing NP (e), and the helices with two missing NPs (f). The parameters are pitch = 19.2 nm, N NP = 10, a NP = 2.5 nm, and R 0 = 8.5 nm. Adapted with permission from ref. 119. Copyright 2011 American Chemical Society.
Fig. 11
Fig. 11. (a and b) DNA origami based templates: (a) CD spectra of left- (red lines) and right-handed (blue lines) helices made of nine gold NPs with 16 nm diameter, showing characteristic bisignate signatures in the visible region (the position and intensity of the peaks could be drastically changed by varying the size of the particles). Adapted with permission from ref. 123. Copyright 2012 Nature Publishing Group. (b) CD spectra of plasmonic right-handed (RH – red traces) and left-handed (LH – black traces) helical monomers, dimers, and toroidal metamolecules. Scheme of the stepwise formation of plasmonic toroidal metamolecules and TEM images of LH and RH toroids (inset). Adapted with permission from ref. 125. Copyright 2016 American Chemical Society. (c) Peptide template; CD spectra and TEM tomography image of left-handed (blue trace, top image) and right-handed (red trace, bottom image) gold NP double helices. Adapted with permission from ref. 132. Copyright 2013 American Chemical Society. (d) Organic self-assembled templates; CD spectra of a hydrogel containing one equivalent of molecules and three mol equivalents of Au(i) ions after increasing durations of UV irradiation for reductive growth of gold NPs on the helical nanofibers. Inset: TEM images after UV irradiation for 1 h, 6 h and 24 h show the increase in particle size with time. Adapted with permission from ref. 145. Copyright 2014 American Chemical Society.
Fig. 12
Fig. 12. (a) CD spectra of P (red) and M (blue) nanocomposites. (b) TEM image of the M nanocomposite exhibiting twisted fibers with nanorods adsorbed on the surface. (c) Representative values of anisotropy factors and the corresponding typical spectral ranges for metal NPs in fluid media. Reproduced with permission from ref. 146. Copyright 2011 Wiley VCH. (d) Ensemble CD spectra of the Au nanodumbbell dimer (no peaks were observed). The inset shows the cartoon depiction of the dimers. (e and f) Experimental single particle CD scattering spectra of the two Au nanodumbbell dimers with twisted side-by-side geometry (the dimers show opposite signs, as expected for two enantiomers). Adapted with permission from ref. 149. Copyright 2016 American Chemical Society.
Fig. 13
Fig. 13. (a) Schematic illustration and cryo-TEM images of assembled right-handed AuNR helices on DNA origami with varying number of rods. (b) Measured CD anisotropy factors of right-handed (RH) and left-handed (LH) AuNR helices corresponding to the structures in the image. Reproduced with permission from ref. 127. Copyright 2015 American Chemical Society. (c) Schematic illustration and TEM images of AuNR dimers on quasi-2D DNA origami. (d) CD spectra corresponding to the dimers in (c), along with their controls. Reproduced with permission from ref. 128. Copyright 2016 American Chemical Society.
Fig. 14
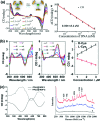
Fig. 14. (a) DNA detection using NR tetramer assemblies. CD curves with increasing concentrations of DNA solution and the CD calibration curves for DNA detection. The longitudinal absorption peak of the NRs used for assembly was 750 nm. The inset shows the schematic illustration for DNA biosensing. Adapted with permission from ref. 151. Copyright 2016 Wiley VCH. (b) Cysteine and glutathione sensing using NRs. CD spectral changes of Au NRs upon addition of l- and d-cysteine. The concentration of cysteine is (i) 0, (ii) 1, (iii) 1.5, (iv) 2.0, (v) 2.5, (vi) 3.0 and (vii) 5 μM. Linear relationship between CD signals at 670 nm and the added concentration of d-Cys or l-Cys. Adapted with permission from ref. 154. Copyright 2016 American Chemical Society. (c) SERS sensor based on Ag NPs@homochiral MOF. CD and the corresponding SERS spectra of (i) h-Ag NPs@MOF-1, (ii) h-Ag NPs@MOF-2 with 1.0 μmol L–1 d-cysteine and (iii) h-Ag NPs@MOF-1 with 1.0 μmol L–1 l-cysteine. Reproduced with permission from ref. 157. Copyright 2016 Royal Society of Chemistry.
None
Jatish Kumar
None
K. George Thomas
None
Luis M. Liz-Marzán

Similar articles

Cited by

References

    1. Kondepudi D. K., Durand D. J. Chirality. 2001;13:351–356. - PubMed
    1. Addadi L., Weiner S. Nature. 2001;411:753–755. - PubMed
    1. Watson J. D., Crick F. H. C. Nature. 1953;171:737–738. - PubMed
    1. Levene P. A. Chem. Rev. 1925;2:179–216.
    1. Buschmann H., Thede R., Heller D. Angew. Chem., Int. Ed. 2000;39:4033–4036. - PubMed

LinkOut - more resources