

Investigation of the interactions of critical scale-up parameters (pH, pO2 and pCO2) on CHO batch performance and critical quality attributes
- PMID: 27752770
- PMCID: PMC5274649
- DOI: 10.1007/s00449-016-1693-7
Investigation of the interactions of critical scale-up parameters (pH, pO2 and pCO2) on CHO batch performance and critical quality attributes
Abstract
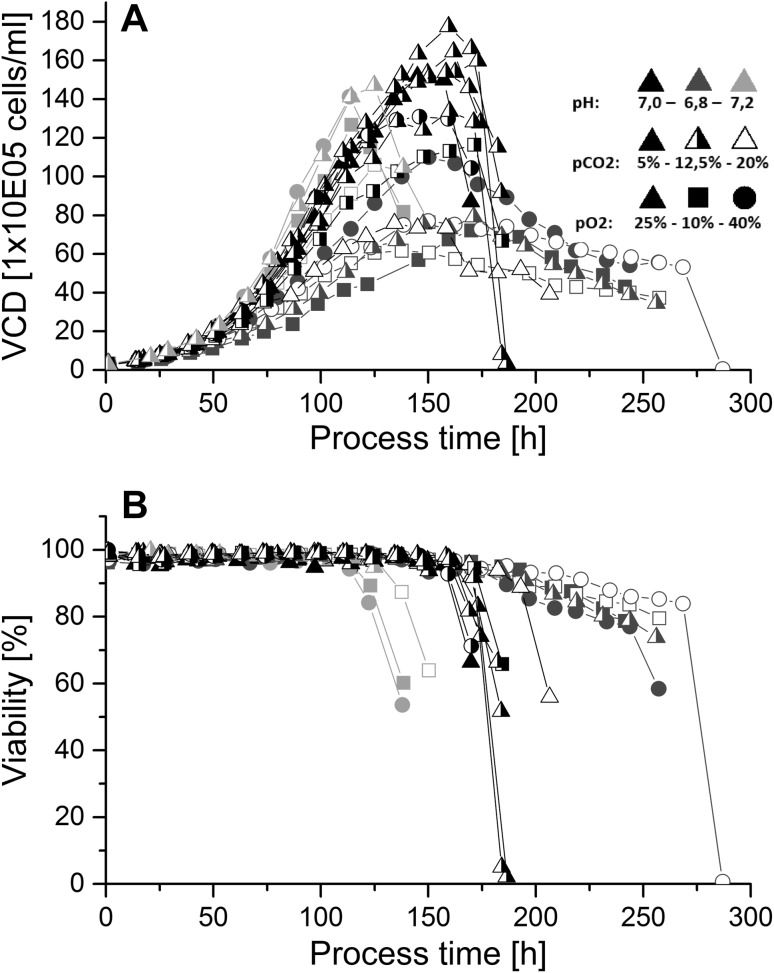
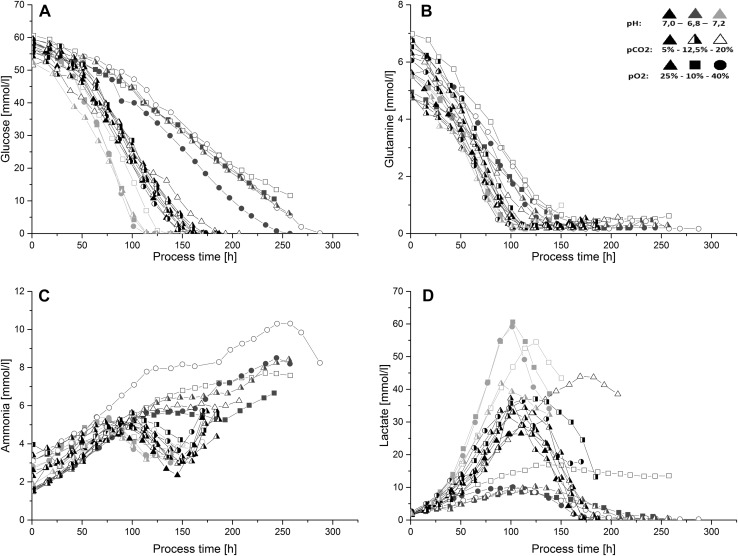
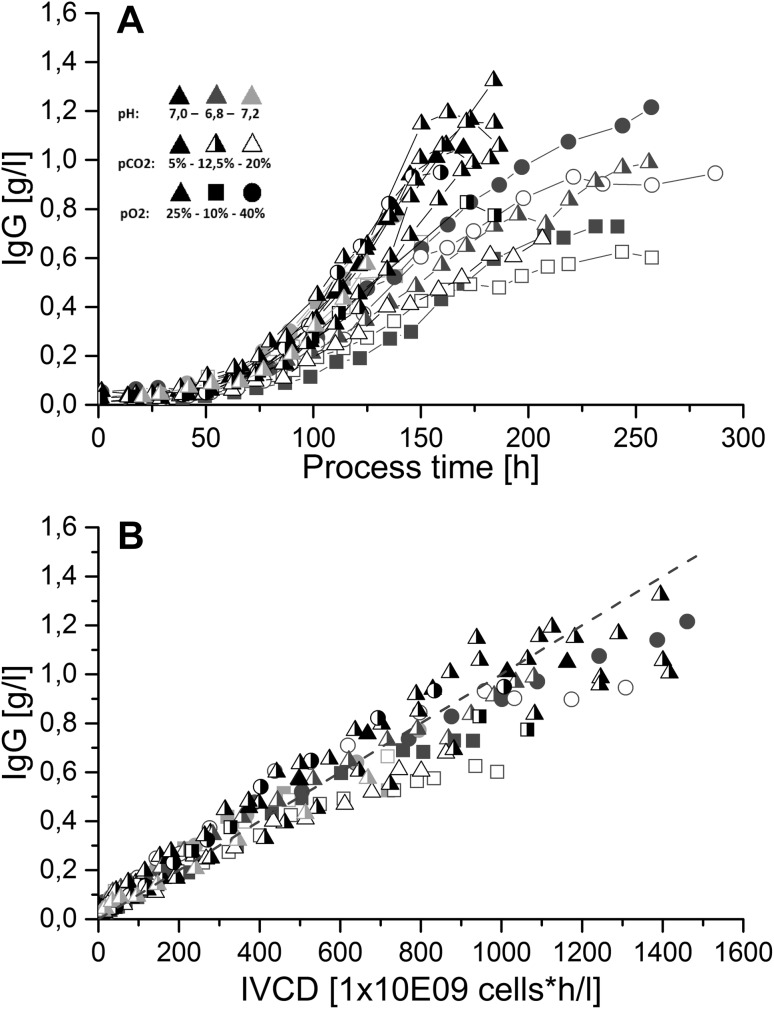
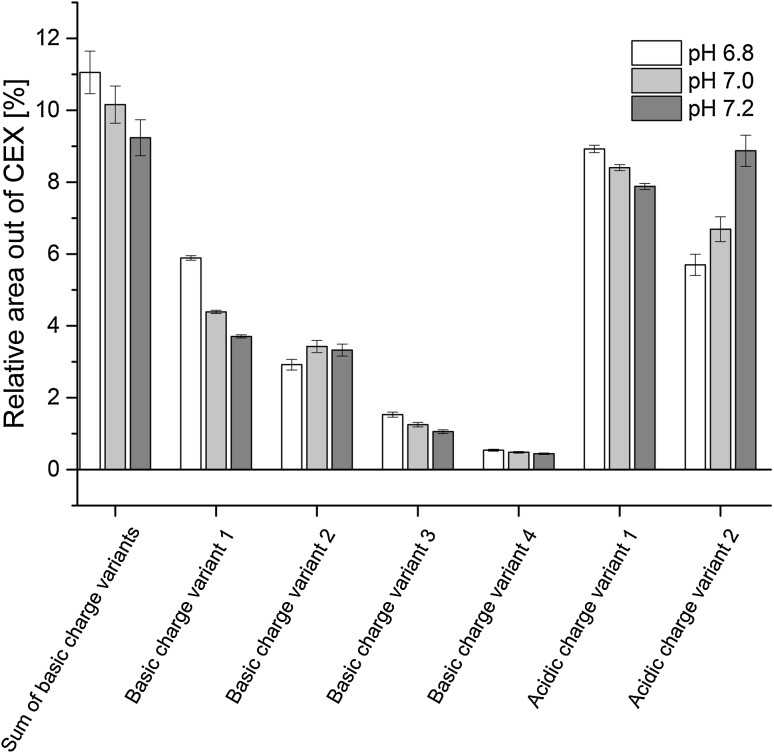
Understanding process parameter interactions and their effects on mammalian cell cultivations is an essential requirement for robust process scale-up. Furthermore, knowledge of the relationship between the process parameters and the product critical quality attributes (CQAs) is necessary to satisfy quality by design guidelines. So far, mainly the effect of single parameters on CQAs was investigated. Here, we present a comprehensive study to investigate the interactions of scale-up relevant parameters as pH, pO2 and pCO2 on CHO cell physiology, process performance and CQAs, which was based on design of experiments and extended product quality analytics. The study used a novel control strategy in which process parameters were decoupled from each other, and thus allowed their individual control at defined set points. Besides having identified the impact of single parameters on process performance and product quality, further significant interaction effects of process parameters on specific cell growth, specific productivity and amino acid metabolism could be derived using this method. Concerning single parameter effects, several monoclonal antibody (mAb) charge variants were affected by process pCO2 and pH. N-glycosylation analysis showed positive correlations between mAb sialylation and high pH values as well as a relationship between high mannose variants and process pH. This study additionally revealed several interaction effects as process pH and pCO2 interactions on mAb charge variants and N-glycosylation pattern. Hence, through our process control strategy and multivariate investigation, novel significant process parameter interactions and single effects were identified which have to be taken into account especially for process scale-up.
Keywords: CHO cell culture; Design of experiments; Monoclonal antibody CQA; Process parameter; Scale-up.
Conflict of interest statement
The authors declare no financial or commercial conflict of interest.
Figures
Similar articles
-
Process parameter shifting: Part I. Effect of DOT, pH, and temperature on the performance of Epo-Fc expressing CHO cells cultivated in controlled batch bioreactors.Biotechnol Bioeng. 2006 Aug 20;94(6):1033-44. doi: 10.1002/bit.21013. Biotechnol Bioeng. 2006. PMID: 16736530
-
A control strategy to investigate the relationship between specific productivity and high-mannose glycoforms in CHO cells.Appl Microbiol Biotechnol. 2016 Aug;100(16):7011-24. doi: 10.1007/s00253-016-7380-4. Epub 2016 Feb 24. Appl Microbiol Biotechnol. 2016. PMID: 26910040 Free PMC article.
-
Process parameter shifting: Part II. Biphasic cultivation-A tool for enhancing the volumetric productivity of batch processes using Epo-Fc expressing CHO cells.Biotechnol Bioeng. 2006 Aug 20;94(6):1045-52. doi: 10.1002/bit.20958. Biotechnol Bioeng. 2006. PMID: 16736532
-
Living with heterogeneities in bioreactors: understanding the effects of environmental gradients on cells.Mol Biotechnol. 2006 Nov;34(3):355-81. doi: 10.1385/MB:34:3:355. Mol Biotechnol. 2006. PMID: 17284782 Review.
-
Recent advances in the understanding of biological implications and modulation methodologies of monoclonal antibody N-linked high mannose glycans.Biotechnol Bioeng. 2014 Oct;111(10):1907-19. doi: 10.1002/bit.25318. Epub 2014 Aug 7. Biotechnol Bioeng. 2014. PMID: 24975601 Review.
Cited by
-
Temporal Galactose-Manganese Feeding in Fed-Batch and Perfusion Bioreactors Modulates UDP-Galactose Pools for Enhanced mAb Glycosylation Homogeneity.Biotechnol Bioeng. 2025 Jul;122(7):1710-1723. doi: 10.1002/bit.28999. Epub 2025 Apr 18. Biotechnol Bioeng. 2025. PMID: 40251805 Free PMC article.
-
An overview of drive systems and sealing types in stirred bioreactors used in biotechnological processes.Appl Microbiol Biotechnol. 2021 Mar;105(6):2225-2242. doi: 10.1007/s00253-021-11180-7. Epub 2021 Mar 2. Appl Microbiol Biotechnol. 2021. PMID: 33649923 Free PMC article. Review.
-
Suitability of transiently expressed antibodies for clinical studies: product quality consistency at different production scales.MAbs. 2022 Jan-Dec;14(1):2052228. doi: 10.1080/19420862.2022.2052228. MAbs. 2022. PMID: 35323099 Free PMC article.
-
Model-assisted DoE software: optimization of growth and biocatalysis in Saccharomyces cerevisiae bioprocesses.Bioprocess Biosyst Eng. 2021 Apr;44(4):683-700. doi: 10.1007/s00449-020-02478-3. Epub 2021 Jan 20. Bioprocess Biosyst Eng. 2021. PMID: 33471162 Free PMC article.
-
Designing a Strategy for pH Control to Improve CHO Cell Productivity in Bioreactor.Avicenna J Med Biotechnol. 2021 Jul-Sep;13(3):123-130. doi: 10.18502/ajmb.v13i3.6365. Avicenna J Med Biotechnol. 2021. PMID: 34484641 Free PMC article.
References
-
- Hernandez R. Top trends in biopharmaceutical manufacturing: 2015. Pharm Technol. 2015;39(6):24–29.
-
- Jayapal KP, Wlaschin KF, Hu W-S, Yap MGS. Recombinant protein therapeutics from CHO cells-20 years and counting. Chem Eng Prog. 2007;103:40–47.
MeSH terms
Substances
LinkOut - more resources
Full Text Sources
Other Literature Sources
