. 2016 Dec;15(23):3240-3250.
doi: 10.1080/15384101.2016.1241930. Epub 2016 Oct 18.

Dysfunctional mitochondrial fission impairs cell reprogramming

Affiliations

Dysfunctional mitochondrial fission impairs cell reprogramming

Javier Prieto et al. Cell Cycle. 2016 Dec.

Abstract

We have recently shown that mitochondrial fission is induced early in reprogramming in a Drp1-dependent manner; however, the identity of the factors controlling Drp1 recruitment to mitochondria was unexplored. To investigate this, we used a panel of RNAi targeting factors involved in the regulation of mitochondrial dynamics and we observed that MiD51, Gdap1 and, to a lesser extent, Mff were found to play key roles in this process. Cells derived from Gdap1-null mice were used to further explore the role of this factor in cell reprogramming. Microarray data revealed a prominent down-regulation of cell cycle pathways in Gdap1-null cells early in reprogramming and cell cycle profiling uncovered a G2/M growth arrest in Gdap1-null cells undergoing reprogramming. High-Content analysis showed that this growth arrest was DNA damage-independent. We propose that lack of efficient mitochondrial fission impairs cell reprogramming by interfering with cell cycle progression in a DNA damage-independent manner.

Keywords: Gdap1; cell reprogramming; iPS cells; mitochondrial fission; pluripotency.


Figures

Figure 1.
Figure 1.
Knockdown of pro-fission factors impairs mitochondrial fission and cell reprogramming. (A) Graph showing the number of Alkaline Phosphatase (AP)-positive colonies obtained in wild type MEFs transfected with the indicated esiRNAs after 25 days of retroviral delivery of the OSKM factors, (n = 3; **P < 0.01; ****P < 0.0001). Panels in the right show representative bright field images and a magnification (inset) of the plates of the indicated cultures after AP-staining. (B) Left panels, representative confocal images of OSKM-transduced cells transfected with the indicated esiRNAs that were stained with anti-Tom20 antibody (red). Inset shows a magnification of the indicated area in the images of the left. Hoechst (blue) was used as a nuclear counterstaining. Scale bar 24 μm. Graph on the right shows the quantification of the different mitochondrial morphologies observed in the cells treated as before, (n = 3; *P < 0.05; **P < 0.01; ***P < 0.001). Data are represented as mean ± s.e.m. One-tailed unpaired Student's t-test was used to compare data sets.
Figure 2.
Figure 2.
Lack of Gdap1 gene impairs OSKM-induced mitochondrial fission. (A) Graph showing the number of Alkaline Phosphatase (AP)-positive colonies obtained in wild type or Gdap1-null MEFs after 25 days of retroviral delivery of the OSKM factors, (n = 6; ****P < 0.0001). Panels in the right show representative bright field images and a magnification (inset) of the AP-staining. (B) Left panels, representative confocal images of wild type or Gdap1-null cells stained with anti-Tom20 antibody (red) before (control) or after expressing the OSKM factors for 4 days (OSKM). Arrowheads point to cells with fragmented mitochondria. Hoechst (blue) was used as a nuclear counterstaining. Scale bar 24 μm. Graph on the right shows the quantification of the different mitochondrial morphologies observed in MEFs of the indicated genotypes before (control) or 4 days after OSKM expression (OSKM), (n = 3; all differences were found to be statistically significant P < 0.05). (C) Representative confocal images of mesenchymal or epithelial-like colonies found in wild type (upper panels) or Gdap1-null (lower panels) MEFs, at day 8 of reprogramming, incubated with Phalloidin (green) to stain F-actin and anti-Tom20 antibody (red) to label mitochondria. Scale bars in left panels 24 μm, middle panels 40 μm. Rightmost images are a magnification of the indicated area in the middle panels. Scale bar, 15 μm. Hoechst (blue) was used as a nuclear counterstaining. Graph at the bottom shows the quantification of the indicated mitochondrial morphologies observed in the cultures at day 8 (n = 3; all differences were found to be statistically significant P < 0.05). (D) Graph showing the number of epithelial-like colonies obtained in wild type or Gdap1-null MEFs at day 8 of reprogramming, (n = 3; *P < 0.05). (E) Total RNA was extracted from wild type MEFs at day 4 of reprogramming (OSKM), wild type iPS or ES cells, and Gdap1 gene expression was assessed by qPCR and represented as relative gene expression normalized to untreated wild type MEFs (Control). (n = 3; ****P < 0.0001). Data are represented as mean ± s.e.m. One-tailed unpaired Student's t-test was used to compare data sets.
Figure 3.
Figure 3.
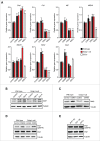
Expression of mitochondrial dynamics regulatory factors in somatic and pluripotent cells. (A) Total RNA was extracted from wild type (black bars) or Gdap1-null (red bars) MEFs left untreated (control) or OSKM-infected for 4 days (OKSM), or from the indicated pluripotent cells (iPSCs). The expression of the indicated genes was then assessed by qPCR and represented as relative gene expression normalized to control wild type MEFs of the corresponding genotype. Gene expression of the indicated genes in E14Tg2a ES cells (ESCs) is included as control (white bars), (n = 3; **P < 0.01; ***P < 0.001). (B-E) Pluripotent cells or MEFs of the indicated genotypes, were left untreated (control) or OSKM-infected (OSKM) for the indicated days. Then, cellular lysates were analyzed by immunoblotting using anti-Opa1 (B), anti-Mfn2 (C), or anti-phospho S579S-Drp1 or anti-Drp1 antibodies (D, E), as indicated. Tubulin antibody, shown in the lower panels, was used as a loading control.
Figure 4.
Figure 4.
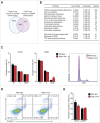
Molecular analysis of cell reprogramming in the absence of Gdap1. (A) Venn diagram showing overlap of Differentially Expressed Genes (DEGs) among control and OSKM-transduced MEFs data sets from both genotypes. (B) GenMAPP analysis comparing OSKM-transduced wild type and Gdap1-null data sets. All downregulated (top, negative Log of ratio) or upregulated (bottom, positive Log of ratio) pathways in Gdap1-null cells relative to wild type MEFs at day 4 of reprogramming are shown. (C) Graphs showing the assessment of the percentages of cells in the different phases of the cell cycle at day zero (left bars diagram) or day 4 of reprogramming (right bars diagram), (n = 3; **P < 0.01). Histogram on the right shows the cell cycle distribution of the indicated genotypes at day 4 of reprogramming. (D) Representative dot plots of wild type or Gdap1-null MEFs transduced with the OSKM factors that were stained with Propidium Iodide (PtdIns) and FITC-conjugated Annexin V for assessing cell death 4 days after viral transduction. Data in the plots are represented as mean ± s.e.m. (n = 3, differences were non significant). (E) Graph showing the quantification of the data corresponding to wild type or Gdap1-null MEFs transduced with OSKM viruses for 4 days, processed for immunofluorescence with anti-γH2AX- or -p53BP1 antibodies and analyzed by High-Content microscopy (n = 3, differences were non-significant). Data are represented as mean ± s.e.m. One-tailed unpaired Student's t-test was used to compare data sets.

Comment in

  • Fission for reprogramming.
    Muñoz JP, Zorzano A. Muñoz JP, et al. Cell Cycle. 2017 Jan 17;16(2):159-160. doi: 10.1080/15384101.2016.1259898. Epub 2016 Dec 8. Cell Cycle. 2017. PMID: 27929736 Free PMC article. No abstract available.

References

    1. Westermann B. Mitochondrial fusion and fission in cell life and death. Nat Rev Mol Cell Biol 2010; 11:872-884; PMID:21102612; http://dx.doi.org/10.1038/nrm3013 - DOI - PubMed
    1. Chan DC. Fusion and fission: interlinked processes critical for mitochondrial health. Annu Rev Genet 2012; 46:265-287; PMID:22934639; http://dx.doi.org/10.1146/annurev-genet-110410-132529 - DOI - PubMed
    1. Nunnari J, Suomalainen A. Mitochondria: in sickness and in health. Cell 2012; 148:1145-1159; PMID:22424226; http://dx.doi.org/10.1016/j.cell.2012.02.035 - DOI - PMC - PubMed
    1. Youle RJ, van der Bliek AM. Mitochondrial fission, fusion, and stress. Science 2012; 337:1062-1065; PMID:22936770; http://dx.doi.org/10.1126/science.1219855. - DOI - PMC - PubMed
    1. Scorrano L. Keeping mitochondria in shape: a matter of life and death. Eur J Clin Invest 2013; 43:886-893 PMID:23869410; http://dx.doi.org/10.1111/eci.12135. - DOI - PubMed

MeSH terms