

Tryptophan and Cysteine Mutations in M1 Helices of α1β3γ2L γ-Aminobutyric Acid Type A Receptors Indicate Distinct Intersubunit Sites for Four Intravenous Anesthetics and One Orphan Site
- PMID: 27753644
- PMCID: PMC5117677
- DOI: 10.1097/ALN.0000000000001390
Tryptophan and Cysteine Mutations in M1 Helices of α1β3γ2L γ-Aminobutyric Acid Type A Receptors Indicate Distinct Intersubunit Sites for Four Intravenous Anesthetics and One Orphan Site
Abstract
Background: γ-Aminobutyric acid type A (GABAA) receptors mediate important effects of intravenous general anesthetics. Photolabel derivatives of etomidate, propofol, barbiturates, and a neurosteroid get incorporated in GABAA receptor transmembrane helices M1 and M3 adjacent to intersubunit pockets. However, photolabels have not been consistently targeted at heteromeric αβγ receptors and do not form adducts with all contact residues. Complementary approaches may further define anesthetic sites in typical GABAA receptors.
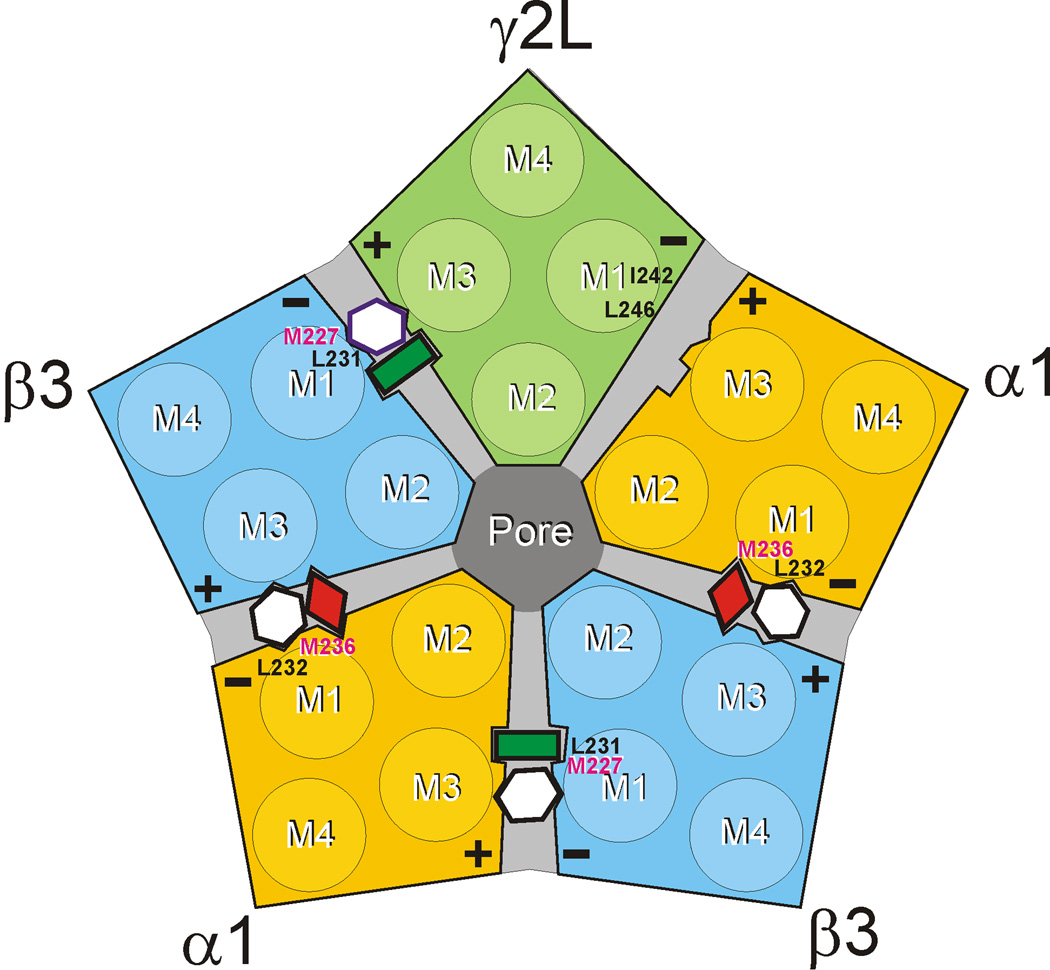
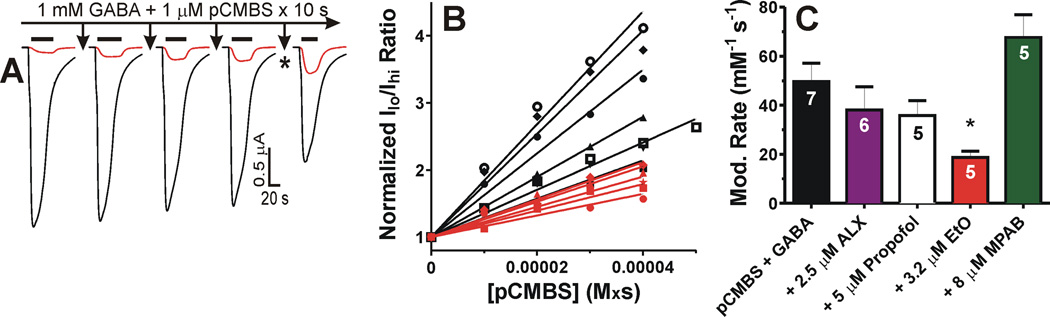
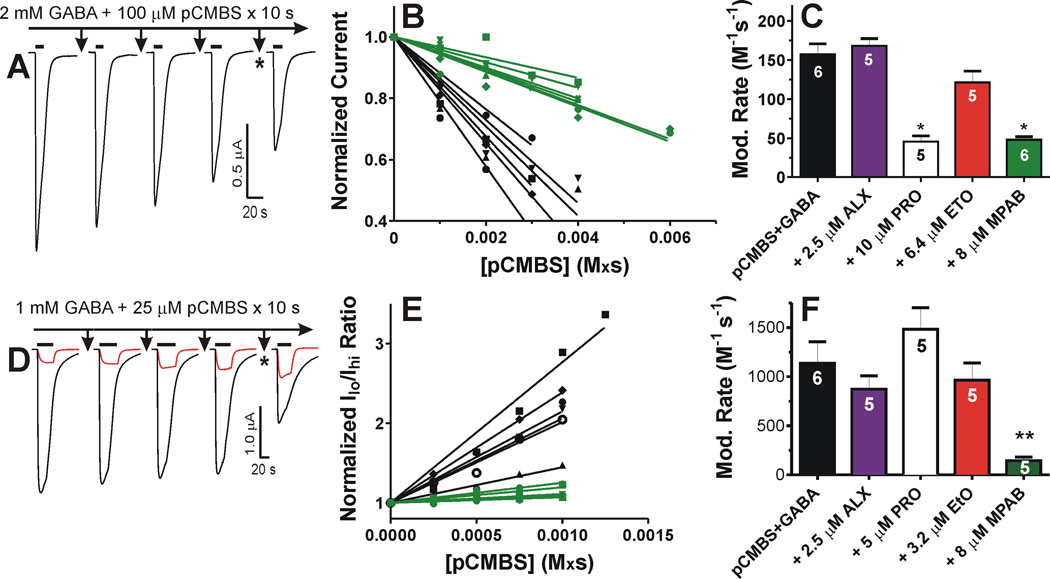
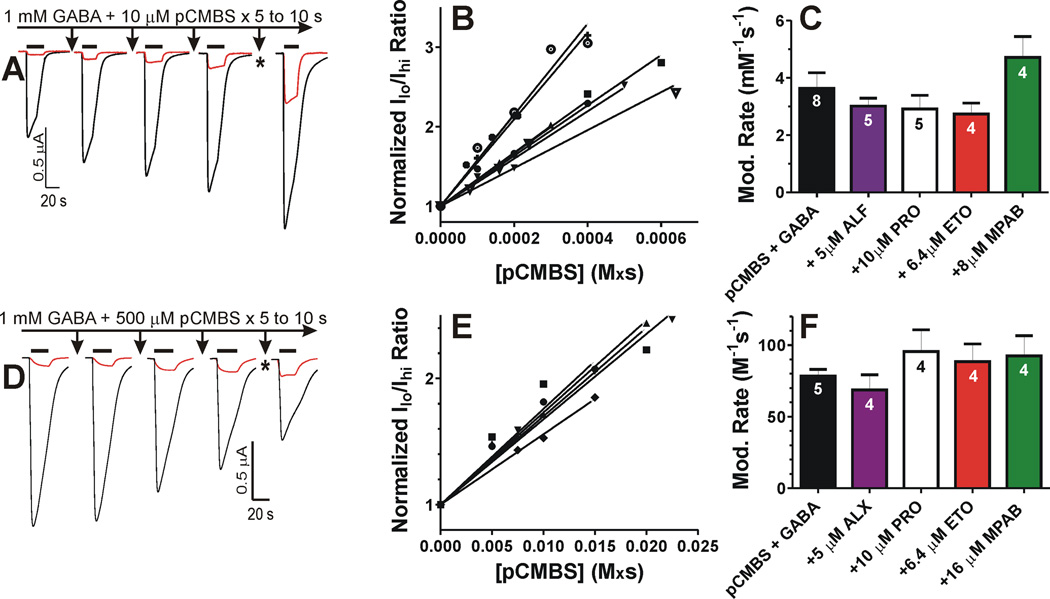
Methods: Two mutation-based strategies, substituted tryptophan sensitivity and substituted cysteine modification-protection, combined with voltage-clamp electrophysiology in Xenopus oocytes, were used to evaluate interactions between four intravenous anesthetics and six amino acids in M1 helices of α1, β3, and γ2L GABAA receptor subunits: two photolabeled residues, α1M236 and β3M227, and their homologs.
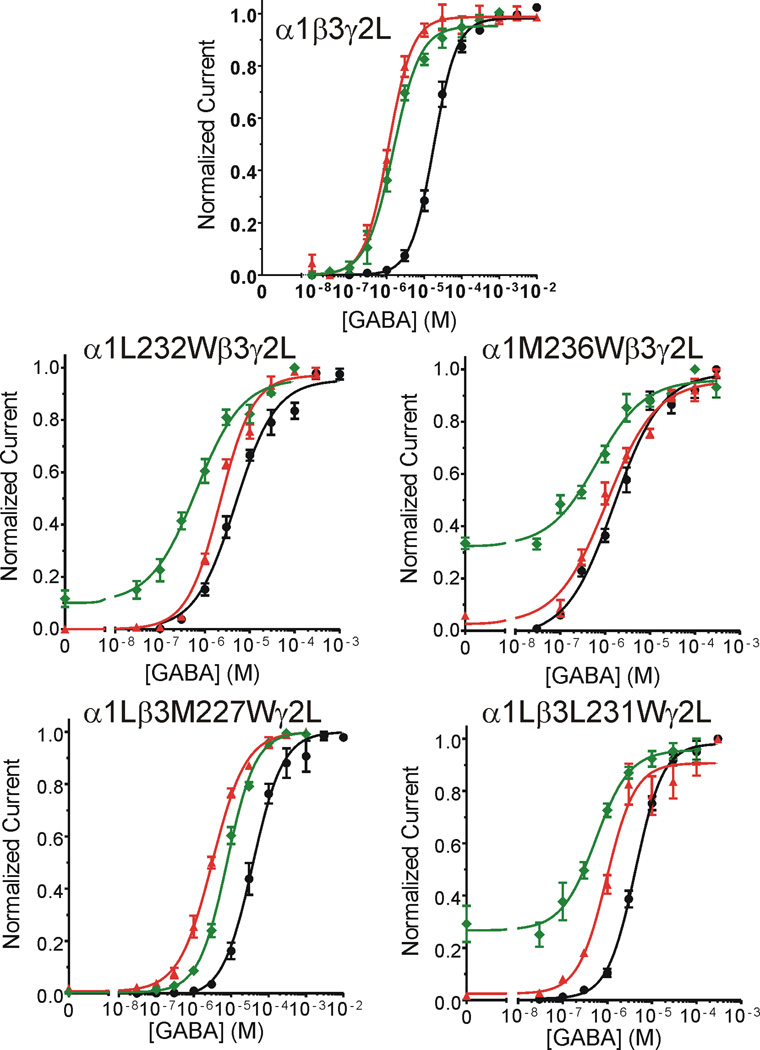
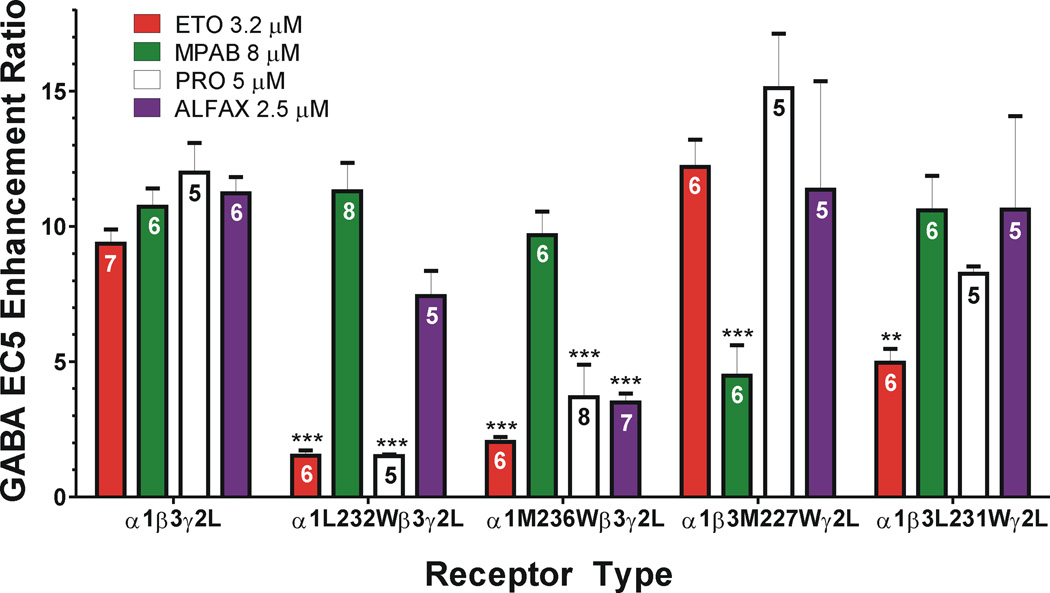
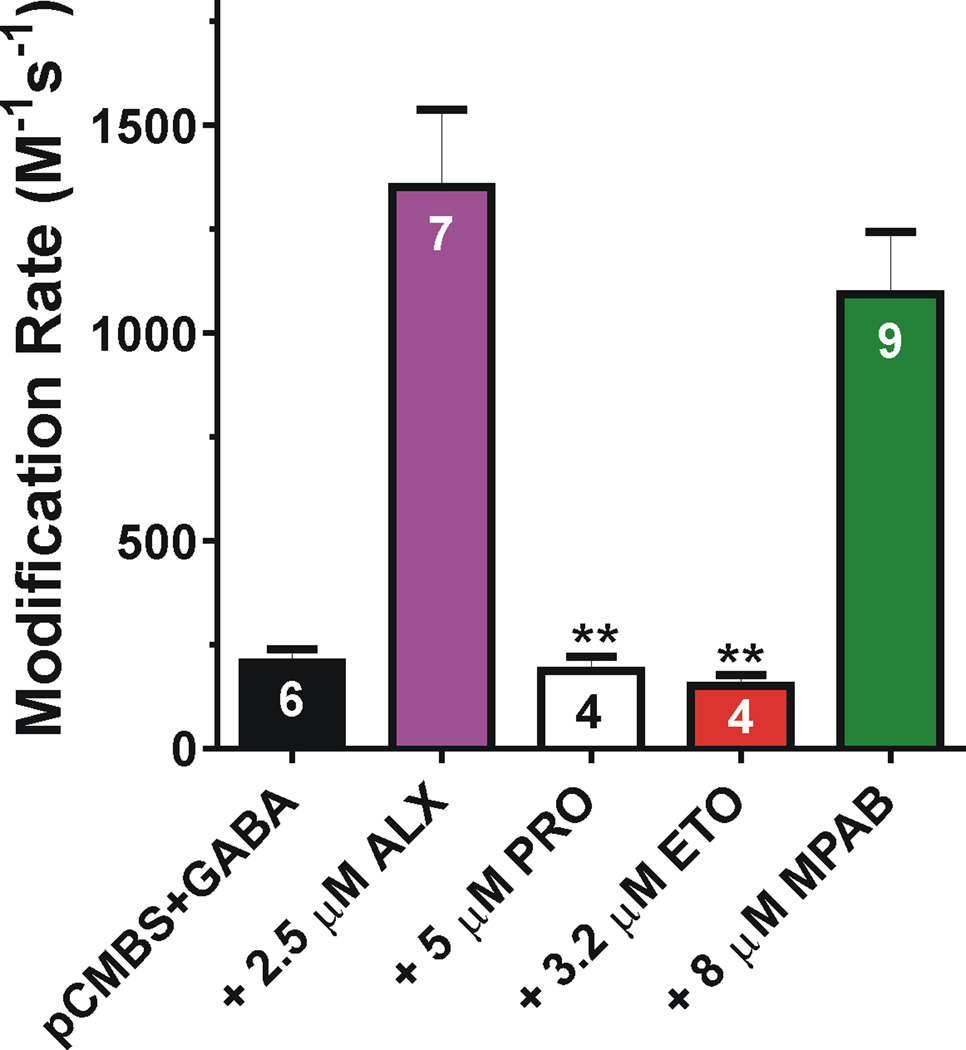
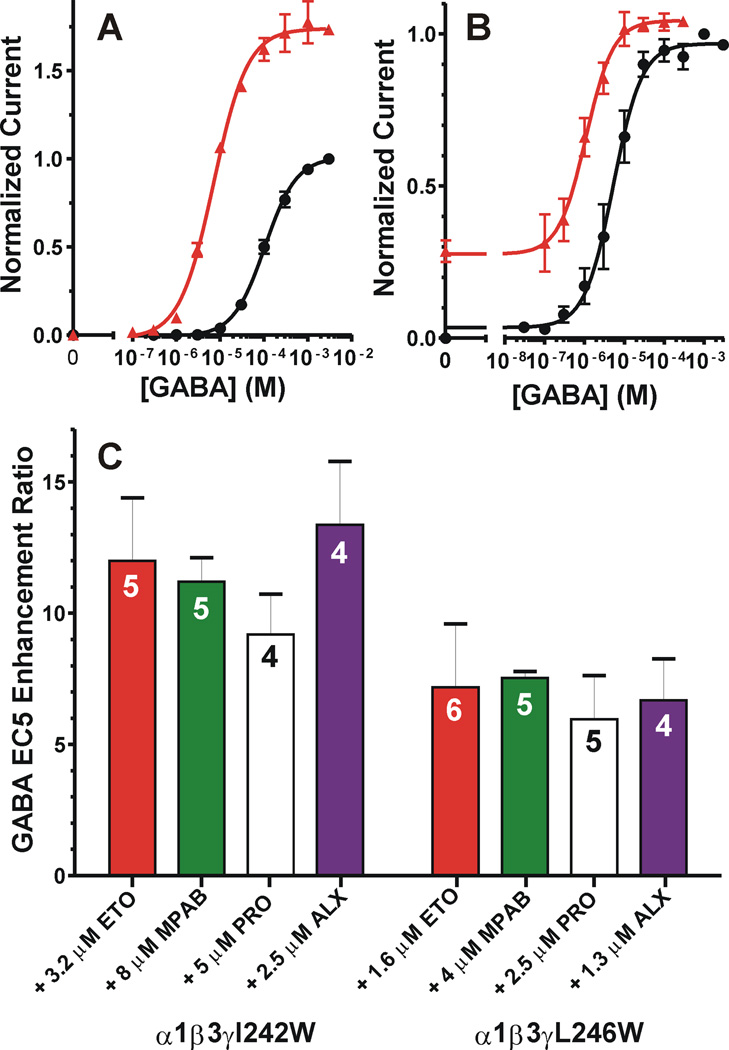
Results: Tryptophan substitutions at α1M236 and positional homologs β3L231 and γ2L246 all caused spontaneous channel gating and reduced γ-aminobutyric acid EC50. Substituted cysteine modification experiments indicated etomidate protection at α1L232C and α1M236C, R-5-allyl-1-methyl-5-(m-trifluoromethyl-diazirinylphenyl) barbituric acid protection at β3M227C and β3L231C, and propofol protection at α1M236C and β3M227C. No alphaxalone protection was evident at the residues the authors explored, and none of the tested anesthetics protected γ2I242C or γ2L246C.
Conclusions: All five intersubunit transmembrane pockets of GABAA receptors display similar allosteric linkage to ion channel gating. Substituted cysteine modification and protection results were fully concordant with anesthetic photolabeling at α1M236 and β3M227 and revealed overlapping noncongruent sites for etomidate and propofol in β-α interfaces and R-5-allyl-1-methyl-5-(m-trifluoromethyl-diazirinylphenyl) barbituric acid and propofol in α-β and γ-β interfaces. The authors' results identify the α-γ transmembrane interface as a potentially unique orphan modulator site.
Conflict of interest statement
The authors have no conflicts of interest related to this work.
Figures
Comment in
-
Anesthetic-Receptor Relationship Status: It's Complicated.Anesthesiology. 2016 Dec;125(6):1088-1089. doi: 10.1097/ALN.0000000000001391. Anesthesiology. 2016. PMID: 27753643 Free PMC article. No abstract available.
Similar articles
-
Alphaxalone Binds in Inner Transmembrane β+-α- Interfaces of α1β3γ2 γ-Aminobutyric Acid Type A Receptors.Anesthesiology. 2018 Feb;128(2):338-351. doi: 10.1097/ALN.0000000000001978. Anesthesiology. 2018. PMID: 29210709 Free PMC article.
-
A Cysteine Substitution Probes β3H267 Interactions with Propofol and Other Potent Anesthetics in α1β3γ2L γ-Aminobutyric Acid Type A Receptors.Anesthesiology. 2016 Jan;124(1):89-100. doi: 10.1097/ALN.0000000000000934. Anesthesiology. 2016. PMID: 26569173 Free PMC article.
-
Monod-Wyman-Changeux Allosteric Shift Analysis in Mutant α1β3γ2L GABAA Receptors Indicates Selectivity and Crosstalk among Intersubunit Transmembrane Anesthetic Sites.Mol Pharmacol. 2019 Apr;95(4):408-417. doi: 10.1124/mol.118.115048. Epub 2019 Jan 29. Mol Pharmacol. 2019. PMID: 30696720 Free PMC article.
-
Mapping General Anesthetic Sites in Heteromeric γ-Aminobutyric Acid Type A Receptors Reveals a Potential For Targeting Receptor Subtypes.Anesth Analg. 2016 Nov;123(5):1263-1273. doi: 10.1213/ANE.0000000000001368. Anesth Analg. 2016. PMID: 27167687 Free PMC article. Review.
-
Etomidate and other non-barbiturates.Handb Exp Pharmacol. 2008;(182):267-82. doi: 10.1007/978-3-540-74806-9_13. Handb Exp Pharmacol. 2008. PMID: 18175096 Review.
Cited by
-
Modulation of the mammalian GABAA receptor by type I and type II positive allosteric modulators of the α7 nicotinic acetylcholine receptor.Br J Pharmacol. 2022 Dec;179(24):5323-5337. doi: 10.1111/bph.15948. Epub 2022 Sep 27. Br J Pharmacol. 2022. PMID: 36082615 Free PMC article.
-
Alphaxalone Binds in Inner Transmembrane β+-α- Interfaces of α1β3γ2 γ-Aminobutyric Acid Type A Receptors.Anesthesiology. 2018 Feb;128(2):338-351. doi: 10.1097/ALN.0000000000001978. Anesthesiology. 2018. PMID: 29210709 Free PMC article.
-
Mutational Analysis of Anesthetic Binding Sites and Their Effects on GABAA Receptor Activation and Modulation by Positive Allosteric Modulators of the α7 Nicotinic Receptor.Biomolecules. 2023 Apr 20;13(4):698. doi: 10.3390/biom13040698. Biomolecules. 2023. PMID: 37189445 Free PMC article.
-
The Actions of Drug Combinations on the GABAA Receptor Manifest as Curvilinear Isoboles of Additivity.Mol Pharmacol. 2017 Nov;92(5):556-563. doi: 10.1124/mol.117.109595. Epub 2017 Aug 8. Mol Pharmacol. 2017. PMID: 28790148 Free PMC article.
-
Substituted Cysteine Modification and Protection with n-Alkyl-MTS Reagents Quantifies Steric Changes Induced by a Mutation in Anesthetic Binding Sites on GABA Type A Receptors.Mol Pharmacol. 2023 Dec;104(6):266-274. doi: 10.1124/molpharm.123.000719. Epub 2023 Aug 16. Mol Pharmacol. 2023. PMID: 37586749 Free PMC article.
References
-
- Jurd R, Arras M, Lambert S, Drexler B, Siegwart R, Crestani F, Zaugg M, Vogt KE, Ledermann B, Antkowiak B, Rudolph U. General anesthetic actions in vivo strongly attenuated by a point mutation in the GABA(A) receptor beta3 subunit. FASEB J. 2003;17:250–252. - PubMed
-
- Zeller A, Arras M, Jurd R, Rudolph U. Identification of a molecular target mediating the general anesthetic actions of pentobarbital. Mol Pharmacol. 2007;71:852–859. - PubMed
-
- Mihalek RM, Banerjee PK, Korpi ER, Quinlan JJ, Firestone LL, Mi ZP, Lagenaur C, Tretter V, Sieghart W, Anagnostaras SG, Sage JR, Fanselow MS, Guidotti A, Spigelman I, Li Z, DeLorey TM, Olsen RW, Homanics GE. Attenuated sensitivity to neuroactive steroids in gamma-aminobutyrate type A receptor delta subunit knockout mice. Proc Natl Acad Sci U S A. 1999;96:12905–12910. - PMC - PubMed
-
- Franks NP. General anaesthesia: from molecular targets to neuronal pathways of sleep and arousal. Nat Rev Neurosci. 2008;9:370–386. - PubMed
Publication types
MeSH terms
Substances
Grants and funding
LinkOut - more resources
Full Text Sources
Other Literature Sources
