. 2017 Feb;55(2):125-130.
doi: 10.1097/MLR.0000000000000631.

Healthy Life-Years Lost and Excess Bed-Days Due to 6 Patient Safety Incidents: Empirical Evidence From English Hospitals

Affiliations

Healthy Life-Years Lost and Excess Bed-Days Due to 6 Patient Safety Incidents: Empirical Evidence From English Hospitals

Katharina D Hauck et al. Med Care. 2017 Feb.

Abstract

Background: There is little satisfactory evidence on the harm of safety incidents to patients, in terms of lost potential health and life-years.

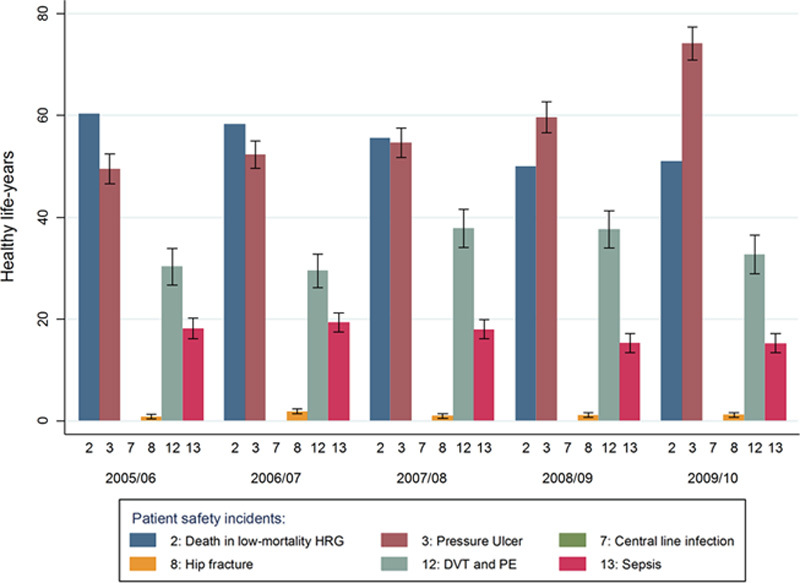
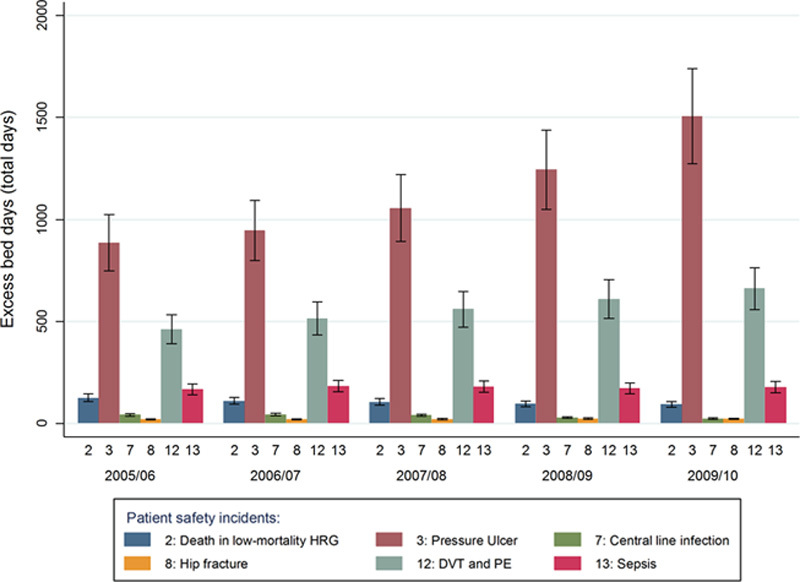
Objective: To estimate the healthy life-years (HLYs) lost due to 6 incidents in English hospitals between the years 2005/2006 and 2009/2010, to compare burden across incidents, and estimate excess bed-days.

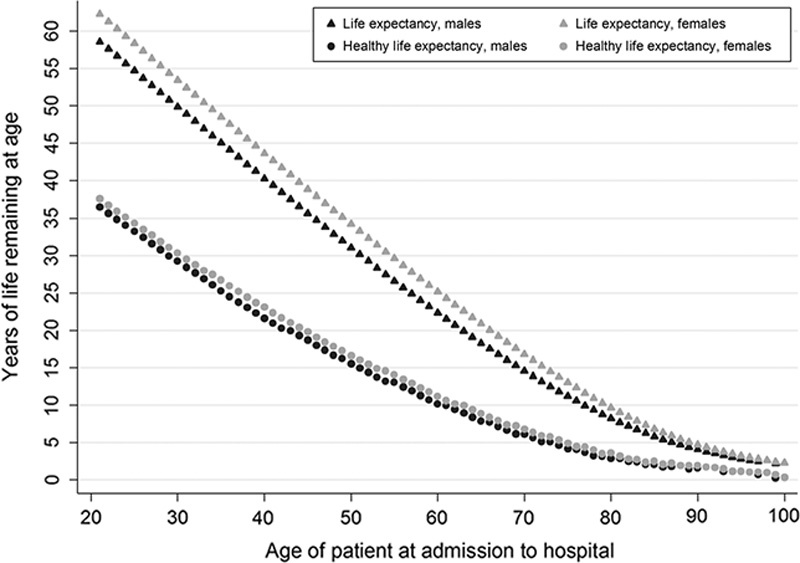
Research design: The study used cross-sectional analysis of the medical records of all inpatients treated in 273 English hospitals. Patients with 6 types of preventable incidents were identified. Total attributable loss of HLYs was estimated through propensity score matching by considering the hypothetical remaining length and quality of life had the incident not occurred.

Results: The 6 incidents resulted in an annual loss of 68 HLYs and 934 excess bed-days per 100,000 population. Preventable pressure ulcers caused the loss of 26 HLYs and 555 excess bed-days annually. Deaths in low-mortality procedures resulted in 25 lost life-years and 42 bed-days. Deep-vein thrombosis/pulmonary embolisms cost 12 HLYs, and 240 bed-days. Postoperative sepsis, hip fractures, and central-line infections cost <6 HLYs and 100 bed-days each.

Discussion: The burden caused by the 6 incidents is roughly comparable with the UK burden of Multiple Sclerosis (80 DALYs per 100,000), HIV/AIDS and Tuberculosis (63 DALYs), and Cervical Cancer (58 DALYs). There were marked differences in the harm caused by the incidents, despite the public attention all of them receive. Decision makers can use the results to prioritize resources into further research and effective interventions.


Conflict of interest statement

The authors declare no conflict of interest.

Figures

FIGURE 1
FIGURE 1
Life expectancy and healthy life expectancy, control patients for pressure ulcers. This figure shows expected remaining life expectancy and healthy life expectancy for males and females. Healthy life expectancy is adjusted for observed comorbidities that were associated with significant reductions in quality of life in matched control patients, and were estimated as part of this study. The values in this figure are for pressure ulcers control patients, and averaged across all English hospitals and the years 2005/2006–2009/2010. Values for other incidents are very similar (see Table SDC9, Supplemental Digital Content 1, http://links.lww.com/MLR/B270). For example, a male of age 50 years in the general population has a remaining life expectancy of around 34 years, and a (population level) healthy life expectancy of 24 years. However, an average 50-year-old male admitted to a hospital in England is in less good health, and has a remaining healthy life expectancy of only around 16 years on average because of comorbidities that are expected to result in reduced quality-of-life over the remaining life-years. If a 50-year-old male hospital patient would contract a pressure ulcer in hospital and die from it, a calculation of lost life-years that did not adjust for quality-of-life would overestimate lost healthy life-years by 18 years.
FIGURE 2
FIGURE 2
Healthy life-years lost due to 6 preventable patient safety incidents, annual totals for an average English hospital. Estimates of annual total healthy life-years lost to incidents for all hospitalized inpatients (≥1 night) at risk in an English hospital with the average number of incidents per year. 95% confidence intervals are indicated by the black bars. The estimate for deaths in low-mortality HRGs is deterministic by definition. The loss is zero for central line infections because mortality risk of patients with incidents was not statistically significantly different from mortality risk of matched control patients without incidents. DVT indicates deep-vein thrombosis; HRG, Healthcare Resource Groups; PE, pulmonary embolism.
FIGURE 3
FIGURE 3
Excess bed-days due to 6 preventable patient safety incidents, annual totals for an average English hospital. Estimates of annual excess bed-days due to incidents for all hospitalized inpatients at risk in an average English hospital. DVT indicates deep-vein thrombosis; PE, pulmonary embolism.

Similar articles

Cited by

References

    1. Landrigan CP, Parry GJ, Bones CB, et al. Temporal trends in rates of patient harm resulting from medical care. New England Journal of Medicine. 2010;363:2124–2134. - PubMed
    1. Downey JR, Hernandez-Boussard T, Banka G, et al. Is patient safety improving? National trends in patient safety indicators: 1998–2007. Health Services Research. 2012;47:414–430. - PMC - PubMed
    1. Drosler SE, Klazinga NS, Romano PS, et al. Application of patient safety indicators internationally: a pilot study among seven countries. Int J Qual Health Care. 2009;21:272–278. - PubMed
    1. Agency for Healthcare Research and Quality. AHRQ Quality Indicators: Patient Safety Indicator v4.5 Benchmark Data Tables. Prepared by Battelle for the Agency for Healthcare Research and Quality. Rockville, MD: US Department of Health and Human Services; 2013.
    1. Wang Y, Eldridge N, Metersky ML, et al. National trends in patient safety for four common conditions, 2005–2011. New England Journal of Medicine. 2014;370:341–351. - PMC - PubMed

MeSH terms